《运营管理》课后习题答案教学文案.docx
《《运营管理》课后习题答案教学文案.docx》由会员分享,可在线阅读,更多相关《《运营管理》课后习题答案教学文案.docx(37页珍藏版)》请在冰点文库上搜索。
《运营管理》课后习题答案教学文案
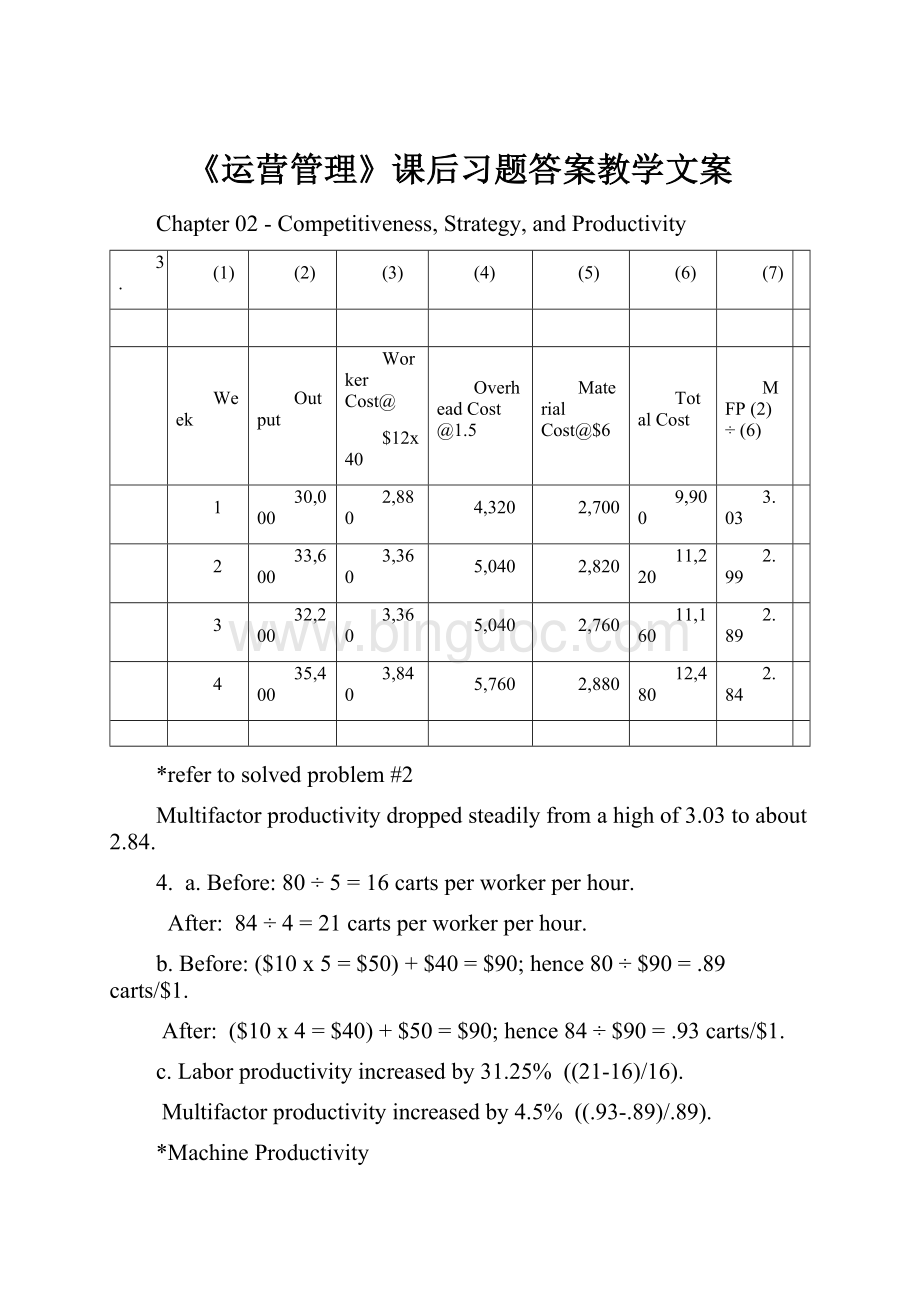
Chapter02-Competitiveness,Strategy,andProductivity
3.
(1)
(2)
(3)
(4)
(5)
(6)
(7)
Week
Output
WorkerCost@
$12x40
OverheadCost@1.5
MaterialCost@$6
TotalCost
MFP
(2)÷(6)
1
30,000
2,880
4,320
2,700
9,900
3.03
2
33,600
3,360
5,040
2,820
11,220
2.99
3
32,200
3,360
5,040
2,760
11,160
2.89
4
35,400
3,840
5,760
2,880
12,480
2.84
*refertosolvedproblem#2
Multifactorproductivitydroppedsteadilyfromahighof3.03toabout2.84.
4.a.Before:
80÷5=16cartsperworkerperhour.
After:
84÷4=21cartsperworkerperhour.
b.Before:
($10x5=$50)+$40=$90;hence80÷$90=.89carts/$1.
After:
($10x4=$40)+$50=$90;hence84÷$90=.93carts/$1.
c.Laborproductivityincreasedby31.25%((21-16)/16).
Multifactorproductivityincreasedby4.5%((.93-.89)/.89).
*MachineProductivity
Before:
80÷40=2carts/$1.
After:
84÷50=1.68carts/$1.
Productivityincreasedby-16%((1.68-2)/2)
Chapter03-ProductandServiceDesign
6.StepsforMakingCashWithdrawalfromanATM
1.InsertCard:
MagneticStripShouldbeFacingDown
2.WatchScreenforInstructions
3.SelectTransactionOptions:
1)Deposit
2)Withdrawal
3)Transfer
4)Other
4.EnterInformation:
1)PINNumber
2)SelectaTransactionandAccount
3)EnterAmountofTransaction
5.Deposit/Withdrawal:
1)Deposit—placeinanenvelope(whichyou’llfindnearorintheATM)andinsertitintothedepositslot
2)Withdrawal—liftthe“WithdrawalDoor,”beingcarefultoremoveallcash
6.Removecardandreceipt(whichservesasthetransactionrecord)
8.
Technical
Requirements
Ingredients
Handling
Preparation
CustomerRequirements
Taste
√
√
Appearance
√
√
√
Texture/consistency
√
√
Chapter04-StrategicCapacityPlanningforProductsandServices
2.
Actualoutput=.8(Effectivecapacity)
Effectivecapacity=.5(Designcapacity)
Actualoutput=(.5)(.8)(Effectivecapacity)
Actualoutput=(.4)(Designcapacity)
Actualoutput=8jobs
Utilization=.4
10.a.Given:
10hrs.or600min.ofoperatingtimeperday.
250daysx600min.=150,000min.peryearoperatingtime.
Totalprocessingtimebymachine
Product
A
B
C
1
48,000
64,000
32,000
2
48,000
48,000
36,000
3
30,000
36,000
24,000
4
60,000
60,000
30,000
Total
186,000
208,000
122,000
Youwouldhavetobuytwo“A”machinesatatotalcostof$80,000,ortwo“B”machinesatatotalcostof$60,000,orone“C”machineat$80,000.
b.Totalcostforeachtypeofmachine:
A
(2):
186,000min÷60=3,100hrs.x$10=$31,000+$80,000=$111,000
B
(2):
208,000÷60=3,466.67hrs.x$11=$38,133+$60,000=$98,133
C
(1):
122,000÷60=2,033.33hrs.x$12=$24,400+$80,000=$104,400
Buy2Bs—thesehavethelowesttotalcost.
Chapter05-ProcessSelectionandFacilityLayout
3.
Desiredoutput=4
Operatingtime=56minutes
Task
#ofFollowingtasks
PositionalWeight
A
4
23
B
3
20
C
2
18
D
3
25
E
2
18
F
4
29
G
3
24
H
1
14
I
0
5
a.Firstrule:
mostfollowers.Secondrule:
largestpositionalweight.
AssemblyLineBalancingTable(CT=14)
WorkStation
Task
TaskTime
TimeRemaining
FeasibletasksRemaining
I
F
5
9
A,D,G
A
3
6
B,G
G
6
–
–
II
D
7
7
B,E
B
2
5
C
C
4
1
–
III
E
4
10
H
H
9
1
–
IV
I
5
9
–
b.Firstrule:
Largestpositionalweight.
AssemblyLineBalancingTable(CT=14)
WorkStation
Task
TaskTime
TimeRemaining
FeasibletasksRemaining
I
F
5
9
A,D,G
D
7
2
–
II
G
6
8
A,E
A
3
5
B,E
B
2
3
–
III
C
4
10
E
E
4
6
–
IV
H
9
5
I
I
5
–
c.
4.
a.l.
2.MinimumCt=1.3minutes
Task
Followingtasks
a
4
b
3
c
3
d
2
e
3
f
2
g
1
h
0
WorkStation
Eligible
Assign
TimeRemaining
IdleTime
I
a
A
1.1
b,c,e,(tie)
B
0.7
C
0.4
一、消费者分析E
0.3
0.3
3、消费“多样化”II
2、你大部分的零用钱用于何处?
d
培养动手能力□学一门手艺□打发时间□兴趣爱好□D
0.0
0.0
III
f,g
F
随着社会经济、文化的飞跃发展,人们正从温饱型步入小康型,崇尚人性和时尚,不断塑造个性和魅力的现代文化价值观念,已成为人们的追求目标。
因此,顺应时代的饰品文化显示出强大的发展势头和越来越广的市场,从事饰品销售是有着广阔的市场空间。
0.5
调研提纲:
G
(3)年龄优势0.2
0.2
IV
大学生的消费是多种多样,丰富多彩的。
除食品外,很大一部分开支都用于。
服饰,娱乐,小饰品等。
女生都比较偏爱小饰品之类的消费。
女生天性爱美,对小饰品爱不释手,因为饰品所展现的魅力,女人因饰品而妩媚动人,亮丽。
据美国商务部调查资料显示女人占据消费市场最大分额,随社会越发展,物质越丰富,女性的时尚美丽消费也越来越激烈。
因此也为饰品业创造了无限的商机。
据调查统计,有50%的同学曾经购买过DIY饰品,有90%的同学表示若在学校附近开设一家DIY手工艺制品,会去光顾。
我们认为:
我校区的女生就占了80%。
相信开饰品店也是个不错的创业方针。
h
H
0.1
0.1
0.6
3.
4.
b.1.
2.Assigna,b,c,d,andetostation1:
2.3minutes[noidletime]
Assignf,g,andhtostation2:
2.3minutes
3.
4.
7.
1
5
4
3
8
7
6
2
Chapter06-WorkDesignandMeasurement
3.
Element
PR
OT
NT
AFjob
ST
1
.90
.46
.414
1.15
.476
2
.85
1.505
1.280
1.15
1.472
3
1.10
.83
.913
1.15
1.050
4
1.00
1.16
1.160
1.15
1.334
Total4.332
8.
A=24+10+14=48minutesper4hours
9.
a.
Element
PR
OT
NT
A
ST
1
1.10
1.19
1.309
1.15
1.505
2
1.15
.83
.955
1.15
1.098
3
1.05
.56
.588
1.15
.676
b.
c.e=.01minutes
Chapter07-LocationPlanningandAnalysis
1.
Factor
Localbank
Steelmill
Foodwarehouse
Publicschool
1.
Convenienceforcustomers
H
L
M–H
M–H
2.
Attractivenessofbuilding
H
L
M
M–H
3.
Nearnesstorawmaterials
L
H
L
M
4.
Largeamountsofpower
L
H
L
L
5.
Pollutioncontrols
L
H
L
L
6.
Laborcostandavailability
L
M
L
L
7.
Transportationcosts
L
M–H
M–H
M
8.
Constructioncosts
M
H
M
M–H
Location(a)
Location(b)
4.
Factor
A
B
C
Weight
A
B
C
1.
BusinessServices
9
5
5
2/9
18/9
10/9
10/9
2.
CommunityServices
7
6
7
1/9
7/9
6/9
7/9
3.
RealEstateCost
3
8
7
1/9
3/9
8/9
7/9
4.
ConstructionCosts
5
6
5
2/9
10/9
12/9
10/9
5.
CostofLiving
4
7
8
1/9
4/9
7/9
8/9
6.
Taxes
5
5
5
1/9
5/9
5/9
4/9
7.
Transportation
6
7
8
1/9
6/9
7/9
8/9
Total
39
44
45
1.0
53/9
55/9
54/9
Eachfactorhasaweightof1/7.
a.
CompositeScores
39
44
45
7
7
7
BorCisthebestandAisleastdesirable.
b.
BusinessServicesandConstructionCostsbothhaveaweightof2/9;theotherfactorseachhaveaweightof1/9.
5x+2x+2x=1⇒x=1/9
c.
CompositeScores
A
B
C
53/9
55/9
54/9
BisthebestfollowedbyCandthenA.
5.
Location
x
y
A
3
7
B
8
2
C
4
6
D
4
1
E
6
4
Totals
25
20
=
∑xi
=
25
=5.0
=
∑yi
=
20
=4.0
n
5
n
5
Hence,thecenterofgravityisat(5,4)andthereforetheoptimallocation.
Chapter08-ManagementofQuality
1.
Checksheet
WorkType
Frequency
LubeandOil
12
Brakes
7
Tires
6
Battery
4
Transmission
1
Total
30
Pareto
2
.
Therunchartsseemstoshowapatternoferrorspossiblylinkedtobreaktimesortheendoftheshift.Perhapsworkersarebecomingfatigued.Ifso,perhapstwo10minutebreaksinthemorningandagainintheafternooninsteadofone20minutebreakcouldreducesomeerrors.Also,errorsareoccurringduringthelastfewminutesbeforenoonandtheendoftheshift,andthoseperiodsshouldalsobegivenmanagement’sattention.
4
Chapter9-QualityControl
4.
Sample
Mean
Range
1
79.48
2.6
MeanChart:
±A2
=79.96±0.58(1.87)
2
80.14
2.3
=79.96±1.08
3
80.14
1.2
UCL=81.04,LCL=78.88
4
79.60
1.7
RangeChart:
UCL=D4
=2.11(1.87)=3.95
5
80.02
2.0
LCL=D3
=0(1.87)=0
6
80.38
1.4
[Bothchartssuggesttheprocessisincontrol:
Neitherhasanypointsoutsidethelimits.]
6.n=200ControlLimits=
Thus,UCLis.0234andLCLbecomes0.
Sincen=200,thefractionrepresentedbyeachdatapointishalftheamountshown.E.g.,1defective=.005,2defectives=.01,etc.
Sample10istoolarge.
7.
Controllimits:
UCLis16.266,LCLbecomes0.
Allvaluesarewithinthelimits.
14.LetUSL=UpperSpecificationLimit,LSL=LowerSpecificationLimit,
=Processmean,σ=Processstandarddeviation
ForprocessH:
ForprocessK:
Assumingtheminimumacceptable
is1.33,since1.0<1.33,theprocessisnotcapable.
ForprocessT:
Since1.33=1.33,theprocessiscapable.
Chapter10-AggregatePlanningandMasterScheduling
7.a.Nobacklogsareallowed
Period
Mar.
Apr.
May
Jun.
July
Aug.
Sep.
Total
Forecast
50
44
55
60
50
40
51
350
Output
Regular
40
40
40
40
40
40
40
280
Overtime
8
8
8
8
8
3
8
51
Subcontract
2
0
3
12
2
0
0
19
Output-Forecast
0
4
–4
0
0
3
–3
Inventory
Beginning
0
0
4
0
0
0
3
Ending
0
4
0
0
0
3
0
Average
0
2
2
0
0
1.5
1.5
7
 升级会员
升级会员 