Zabbix监控HP服务器硬件信息.docx
《Zabbix监控HP服务器硬件信息.docx》由会员分享,可在线阅读,更多相关《Zabbix监控HP服务器硬件信息.docx(11页珍藏版)》请在冰点文库上搜索。
Zabbix监控HP服务器硬件信息
Zabbix监控HP服务器硬件信息
2014-05-1722:
35:
01
标签:
原创作品,允许转载,转载时请务必以超链接形式标明文章、作者信息和本声明。
否则将追究法律责任。
做为Linux系统工程师,在服务器的维护管理当中,除了对系统进行维护管理之外,最重要的还要对服务器的硬件进行监控,比如服务器Raid状态是否正常(如果Raid卡出问题,会影响数据的读写速度),服务器硬盘是否正常(如果硬盘坏掉,严重的情况会丢失数据),服务器电源是否有故障等。
除此之外还要对服务器的CPU,内存,处理器等重要设备的温度进行监控,如果温度超过服务器的临界温度则进行报警通知。
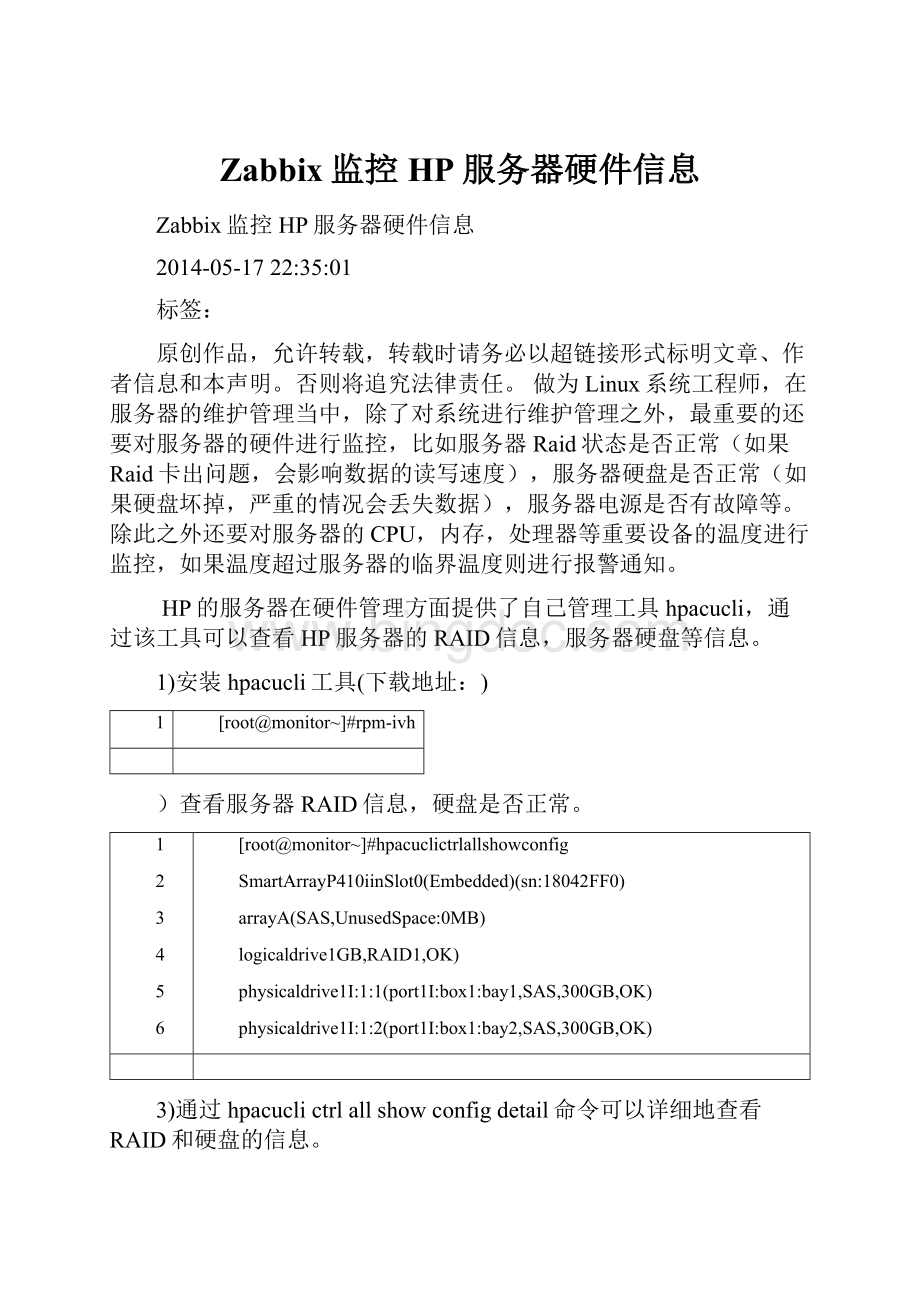
HP的服务器在硬件管理方面提供了自己管理工具hpacucli,通过该工具可以查看HP服务器的RAID信息,服务器硬盘等信息。
1)安装hpacucli工具(下载地址:
)
1
[root@monitor~]#rpm-ivh
)查看服务器RAID信息,硬盘是否正常。
1
2
3
4
5
6
[root@monitor~]#hpacuclictrlallshowconfig
SmartArrayP410iinSlot0(Embedded)(sn:
18042FF0)
arrayA(SAS,UnusedSpace:
0MB)
logicaldrive1GB,RAID1,OK)
physicaldrive1I:
1:
1(port1I:
box1:
bay1,SAS,300GB,OK)
physicaldrive1I:
1:
2(port1I:
box1:
bay2,SAS,300GB,OK)
3)通过hpacuclictrlallshowconfigdetail命令可以详细地查看RAID和硬盘的信息。
1
2
3
4
5
6
7
8
9
10
11
12
13
14
15
16
17
18
19
20
21
22
23
24
25
26
27
28
29
30
31
32
33
34
35
36
37
38
39
40
41
42
43
44
45
46
47
48
49
50
51
52
53
54
55
56
57
58
59
60
61
62
63
64
65
66
67
68
69
70
71
72
73
74
75
76
77
78
[root@monitor~]#hpacuclictrlallshowconfigdetail
SmartArrayP410iinSlot0(Embedded)
BusInterface:
PCI
Slot:
0
SerialNumber:
18042FF0
CacheSerialNumber:
PBCDH0CRH1FH62
RAID6(ADG)Status:
Disabled
ControllerStatus:
OK
ChassisSlot:
HardwareRevision:
RevC
FirmwareVersion:
RebuildPriority:
Medium
ExpandPriority:
Medium
SurfaceScanDelay:
15secs
MonitorandPerformanceDelay:
60min
ElevatorSort:
Enabled
DegradedPerformanceOptimization:
Disabled
InconsistencyRepairPolicy:
Disabled
PostPromptTimeout:
0secs
CacheBoardPresent:
True
CacheStatus:
OK
AcceleratorRatio:
25%Read/75%Write
DriveWriteCache:
Disabled
TotalCacheSize:
512MB
No-BatteryWriteCache:
Disabled
CacheBackupPowerSource:
Capacitors
Battery/CapacitorCount:
1
Battery/CapacitorStatus:
OK
SATANCQSupported:
True
Array:
A
InterfaceType:
SAS
UnusedSpace:
0MB
Status:
OK
LogicalDrive:
1
Size:
GB
FaultTolerance:
RAID1
Heads:
255
SectorsPerTrack:
32
Cylinders:
65535
StripeSize:
128KB
Status:
OK
ArrayAccelerator:
Enabled
UniqueIdentifier:
600508B0002
DiskName:
/dev/cciss/c0d0
MountPoints:
/boot99MB
LogicalDriveLabel:
A00ADBD9PR7AMU1472898D
MirrorGroup0:
physicaldrive1I:
1:
1(port1I:
box1:
bay1,SAS,300GB,OK)
MirrorGroup1:
physicaldrive1I:
1:
2(port1I:
box1:
bay2,SAS,300GB,OK)
physicaldrive1I:
1:
1
Port:
1I
Box:
1
Bay:
1
Status:
OK
DriveType:
DataDrive
InterfaceType:
SAS
Size:
300GB
RotationalSpeed:
10000
FirmwareRevision:
HPD4
SerialNumber:
ECA1PC80GTS31234
Model:
HPEG0300FBDSP
PHYCount:
2
PHYTransferRate:
Unknown
physicaldrive1I:
1:
2
Port:
1I
Box:
1
Bay:
2
Status:
OK
DriveType:
DataDrive
InterfaceType:
SAS
Size:
300GB
RotationalSpeed:
10000
FirmwareRevision:
HPD7
SerialNumber:
PMX6902D
Model:
HPEG0300FBDBR
PHYCount:
2
PHYTransferRate:
Unknown
HP官方还有一个hpasmcli管理工具,可以很详细查看服务器CPU,内存,处理器,电源等的温度信息。
1)安装hpasmcli工具(下载地址:
1
[root@monitor~]#rpm-ivh
通过工具hpasmcli可以查看服务器各部件的温度信息,其中Temp表示各部件当前的温度,Threshold表示临界温度,当当前温度超过临界温度的时候就要注意啦。
1
2
3
4
5
6
7
8
9
10
11
12
13
14
15
16
17
18
19
20
21
22
23
24
25
26
27
28
29
30
31
[root@monitor~]#hpasmcli-s'showtemp'
SensorLocationTempThreshold
---------------------------
#1AMBIENT23C/73F42C/107F
#2CPU#140C/104F82C/179F
#3CPU#240C/104F82C/179F
#4MEMORY_BD33C/91F87C/188F
#5MEMORY_BD33C/91F78C/172F
#6MEMORY_BD-87C/188F
#7MEMORY_BD32C/89F78C/172F
#8MEMORY_BD32C/89F87C/188F
#9MEMORY_BD32C/89F78C/172F
#10MEMORY_BD-87C/188F
#11MEMORY_BD32C/89F78C/172F
#12POWER_SUPPLY_BAY33C/91F59C/138F
#13POWER_SUPPLY_BAY47C/116F73C/163F
#14MEMORY_BD29C/84F72C/161F
#15PROCESSOR_ZONE32C/89F73C/163F
#16PROCESSOR_ZONE30C/86F64C/147F
#17MEMORY_BD28C/82F63C/145F
#18PROCESSOR_ZONE39C/102F69C/156F
#19SYSTEM_BD35C/95F69C/156F
#20SYSTEM_BD38C/100F71C/159F
#21SYSTEM_BD44C/111F65C/149F
#22SYSTEM_BD45C/113F71C/159F
#23SYSTEM_BD39C/102F69C/156F
#24SYSTEM_BD47C/116F69C/156F
#25SYSTEM_BD35C/95F63C/145F
#26SYSTEM_BD45C/113F66C/150F
#27SCSI_BACKPLANE_ZONE35C/95F60C/140F
#28SYSTEM_BD73C/163F110C/230F
3)通过hpasmcli-s'show'查看类似于help的帮助信息,监控的时候要重点关注DIMM(内存)、FANS(风扇)、POWERSUPPLY(电源模块)、SERVER(系统)、CPU、TEMP(温度)等信息。
1
2
3
4
5
6
7
8
9
10
11
12
13
14
15
16
17
18
19
20
21
[root@monitor~]#hpasmcli-s'show'
InvalidArguments
SHOWASR
SHOWBOOT
SHOWDIMM[SPD]
SHOWF1
SHOWFANS
SHOWHT
SHOWIML
SHOWIPL
SHOWNAME
SHOWPORTMAP
SHOWPOWERMETER
SHOWPOWERSUPPLY
SHOWPXE
SHOWSERIAL[BIOS|EMBEDDED|VIRTUAL]
SHOWSERVER
SHOWTEMP
SHOWTPM
SHOWUID
SHOWWOL
4)hpasmcli几种常用的例子。
查看内存信息:
hpasmcli-s'showdimm'|egrep-i'module|stat'
查看风扇信息:
hpasmcli-s'showfans'
查看硬件温度:
hpasmcli-s'showtemp'
查看电源模块:
hpasmcli-s'showpowersupply'
查看机器型号,序列号,CPU,内存大小:
hpasmcli-s'showserver'
由于各种服务器的厂商不同,管理工具不同,因此Zabbix对服务器硬件方面没有很详细,全面的解决方案。
之前dl528888写过zabbix通过omsa工具监控DEL服务器,也是一种很好的思路,我也借鉴过,这里非常感谢。
Zabbix监控总结起来有两种思路:
第一就是server通过agentd方式获取数据,这种方式需要定义UserParameter参数,即KEY。
第二就是server通过trapper的方式获取数据,即agentd将数据主动sender给server或者proxy。
我这里是通过第二种traper的方式监控的。
第一种方式server有时候会取不到数据,becamenotsupported:
Receivedvalue[]
isnotsuitableforvaluetype[Numeric(unsigned)]anddatatype[Decimal],
会产生上面的错误。
首先查看我监控的脚本,由于是通过traper的思路进行监控,log_file文件依次定义了要监控服务器的主机名(hostname),监控项key以及监控的值。
1
2
3
4
5
6
7
8
9
10
11
12
13
14
15
16
17
18
19
20
21
22
23
24
25
26
27
28
29
30
31
32
33
34
35
36
37
38
39
40
41
[root@monitorscripts]#cat
#!
/bin/sh
#createbysfzhang
#ThisscriptsmonitoringHPserver,suchassmartarraystatus,Hardwareinformationandservertemperature。
zabbix_server="*.*.*.*"#IPfromZabbixServerorproxywheredatashouldbesendto.
zabbix_sender="/usr/local/zabbix/bin/zabbix_sender"
log_file='/tmp/'#Inthefiletodefinethemonitorhost,keyandvalue
hpacucli='/usr/sbin/hpacucli'
options='ctrlallshowconfigdetail'
hpacucli_log="/tmp/"
PATH=$PATH:
/usr/sbin:
/sbin
${hpacucli}${options}>${hpacucli_log}
Cache_status=`cat${hpacucli_log}|awk'/CacheStatus:
/{print$NF}'`
Controller_status=`cat${hpacucli_log}|awk'/ControllerStatus:
/{print$NF}'`
Battery_capacitor_status=`cat${hpacucli_log}|awk'/Battery\/CapacitorStatus:
/{print$NF}'`
Physicaldrive_status=$(awk-vtotal=`hpacuclictrlslot=0pdallshowstatus|grepphysicaldrive|wc-l`-vnormal=`hpacuclictrlslot=0pdallshowstatus|awk'/physicaldrive/{if($NF=="OK")count+=1}END{printcount}'`'BEGIN{if(total==normal){print"OK"}else{print"NO"}}')
Memory_status=$(awk-vtotal=`hpasmcli-s'SHOWDIMM'|grep-i'Status'|wc-l`-vnormal=`hpasmcli-s'SHOWDIMM'|awk'/Status:
/{if($NF=="Ok")count+=1}END{printcount}'`'BEGIN{if(total==normal){print"OK"}else{print"NO"}}')
Fans_status=$(awk-vtotal=`hpasmcli-s'SHOWFANS'|grep"#"|wc-l`-vnormal=`hpasmcli-s'SHOWFANS'|awk'/#/{if($3=="Yes")count+=1}END{printcount}'`'BEGIN{if(total==normal){print"OK"}else{print"NO"}}')
Power_status=$(awk-vtotal=`hpasmcli-s'SHOWPOWERSUPPLY'|grep"Powersupply"|wc-l`-vnormal=`hpasmcli-s'SHOWPOWERSUPPLY'|awk'/Condition:
/{if($NF=="Ok")count+=1}END{printcount}'`'BEGIN{if(total==normal){print"OK"}else{print"NO"}}')
Processor_status=$(awk-vtotal=`hpasmcli-s'SHOWSERVER'|grep"Processor:
"|wc-l`-vnormal=`hpasmcli-s'SHOWSERVER'|awk'/Status/{if($NF=="Ok")count+=1}END{printcount}'`'BEGIN{if(total==normal){print"OK"}else{print"NO"}}')
Power_temp_num=$(hpasmcli-s'SHOWTEMP'|awk'/POWER_SUPPLY_BAY/{print$3}'|awk-F"C"'{print$1}'|awk'BEGIN{max=0}{if($1>max)max=$1fi}END{printmax}')
Ambient_temp_num=$(hpasmcli-s'SHOWTEMP'|awk'/AMBIENT/{print$3}'|awk-F"C"'{print$1}')
Cpu_temp_num=$(hpasmcli-s'SHOWTEMP'|awk'/CPU/{print$3}'|awk-F"C"'{print$1}'|awk'BEGIN{max=0}{if($1>max)max=$1fi}END{printmax}')
Memory_temp_num=$(hpasmcli-s'SHOWTEMP'|awk'/MEMORY_BD/{print$3}'|awk-F"C"'{print$1}'|awk'BEGIN{max=0}{if($1>max)max=$1fi}END{printmax}')
System_temp_num=$(hpasmcli-s'SHOWTEMP'|awk'/SYSTEM_BD/{print$3}'|awk-F"C"'{print$1}'|awk'BEGIN{max=0}{if($1>max)max=$1fi}END{printmax}')
Processor_temp_num=$(hpasmcli-s'SHOWTEMP'|awk'/PROCESSOR_ZONE/{print$3}'|awk-F"C"'{print$1}'|awk'BEGIN{max=0}{if($1>max)max=$1fi}END{printmax}')
echo$HOSTNAME$Cache_status>${log_file}
echo$HOSTNAME$Controller_status>>${log_file}
echo$HOSTNAME$Battery_capacitor_status>>${log_file}
echo$HOSTNAME$Physicaldrive_status>>${log_file}
echo$HOSTNAME$Memory_status>>${log_file}
echo$HOSTNAME$Fans_status>>${log_file}
echo$HOSTNAME$Power_status>>${log_file}
echo$HOSTNAME$Processor_status>>${log_file}
echo$HOSTNAME$Power_temp_num>>${log_file}
echo$HOSTNAME$Ambient_temp_num>>${log_file}
echo$HOSTNAME$Cpu_temp_num>>${log_file}
echo$HOSTNAME$Memory_temp_num>>${log_file}
echo$HOSTNAME$System_temp_num>>${log_file}
echo$HOSTNAME$Processor_temp_num>>${log_file}
$zabbix_sender-z$zabbix_server-i${log_file}>/tmp/
最后只需开启crontab,5分钟运行一次。
1
[root@monitor~]echo"*/5****/etc/zabbix/scri">>/var/spool/cron/root
查看zabbix监控HP服务器硬件KEY的定义,数据的收集都是通过trapper的方式收集的。
查看zabbix监控HP服务器硬件triggers定义,其中nodata(600)这个trigger是为了防止被监控端数据采集出问题而设置的,比如crontab不正常,脚本被误删除等等。
如果server10分钟之内收集不到被监控端的数据就会报警。
在zabbixserverlastdata查看zabbixserver通过trapper收到的数据。
查看被监控端服务器各部件温度信息。
当被监控端出问题时Zabbix会及时报警。
说明:
Zabbix监控HP服务器硬件操作方法:
1)在HP服务器上面安装hpacucli和hpasmcli管理工具。
2)修改脚本的zabbix_serverip地址,指定为自己的server或者proxy的地址,并把该脚本添加到crontab。
3)导入附件中的模板,Link到要监控的主机上面即可。
4)如果有其它问题,欢迎多多交流。
 升级会员
升级会员 