雅思A类Task 图表作文实例下Word文件下载.docx
《雅思A类Task 图表作文实例下Word文件下载.docx》由会员分享,可在线阅读,更多相关《雅思A类Task 图表作文实例下Word文件下载.docx(9页珍藏版)》请在冰点文库上搜索。
Tues.
Wed.
Thurs.
Fri.
Sat.
Sun.
Lunch
$2,400
$2,450
$2,595
$2,375
$2,500
$1,950
$1,550
Dinner
$3,623
$3,850
$3,445
$3,800
$4,350
$2,900
modelanswer:
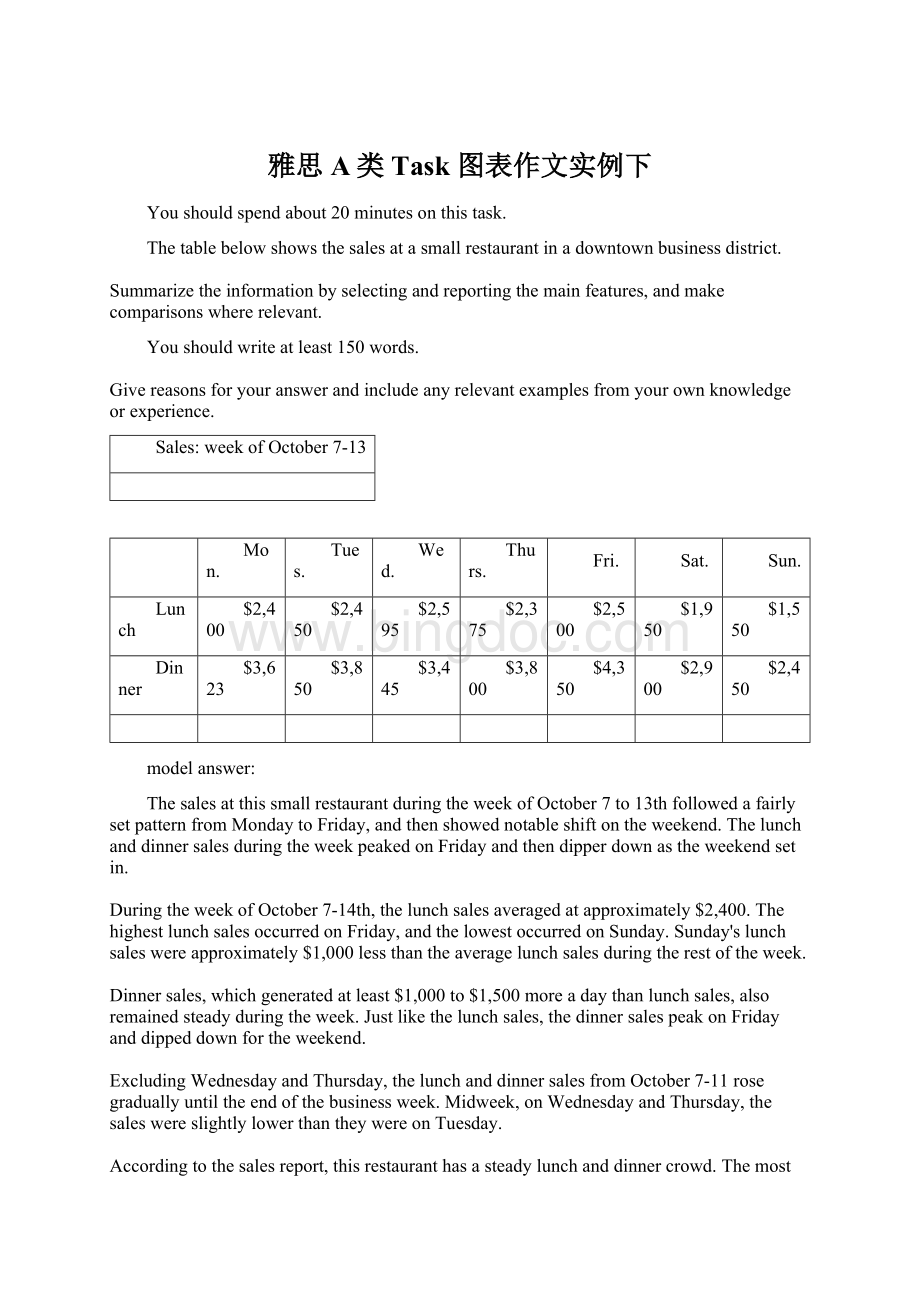
ThesalesatthissmallrestaurantduringtheweekofOctober7to13thfollowedafairlysetpatternfromMondaytoFriday,andthenshowednotableshiftontheweekend.ThelunchanddinnersalesduringtheweekpeakedonFridayandthendipperdownastheweekendsetin.
DuringtheweekofOctober7-14th,thelunchsalesaveragedatapproximately$2,400.ThehighestlunchsalesoccurredonFriday,andthelowestoccurredonSunday.Sunday'
slunchsaleswereapproximately$1,000lessthantheaveragelunchsalesduringtherestoftheweek.
Dinnersales,whichgeneratedatleast$1,000to$1,500moreadaythanlunchsales,alsoremainedsteadyduringtheweek.Justlikethelunchsales,thedinnersalespeakonFridayanddippeddownfortheweekend.
ExcludingWednesdayandThursday,thelunchanddinnersalesfromOctober7-11rosegraduallyuntiltheendofthebusinessweek.Midweek,onWednesdayandThursday,thesaleswereslightlylowerthantheywereonTuesday.
Accordingtothesalesreport,thisrestauranthasasteadylunchanddinnercrowd.ThemostprofitabledayduringthesecondweekofOctoberwasFriday.Sunday,wastheleastprof¬
itableday,withthefullday'
ssalestotaling/totallinglessthantheFridaydinnersales.Thesenumbersarereflectiveofarestaurantthatislocatedinabusiness/financialdistrictwherebusinesshoursareMondaythroughFriday.
(234words)
InJune1996,anexperimentalfluvaccinewastrialledinalargecountrytownonfemalesonly.
Summarisetheinformationbyselectingandreportingthemainfeatures,andmakecomparisonswhererelevant.
Thediagramsshowdataforafluepidemicwhichhitalargecountrytownin1996.Figure1givesthenumberofpersonswhodied;
Figure2showsthepercentagebreakdownoffemaleswhoreceivedanewfluvaccine;
andFigure3givesthenumberofcasesofflubeforeandduringtheepidemic.
InFigure1itcanbeseenthatthefluwasresponsibleforthedeathsof2femalesbutnomalesintheperiodfromMarchtoMay.However,fromJunetoAugust,therewere4femaledeathsand1maledeath.
AccordingtothepiechartinFigure2,onlythosefemalesmostatriskweregiventhenewfluvaccine;
28%didnottakepartinthetrial.Ofthosefemaleswhotookpart,35%wereaged(over65yearsold);
24%werebabiesorchildren;
and13%wereeitherhospitalisedorreceivingothermedicalattention.
FromFigure3itisclearthatthenewvaccinehadapositiveeffectonthenumberofnewcasesofflureportedinfemales.Therewerejustover1000casesreportedinMarch,climbingrapidlytoapeakof3500inJune.Thereafter,thenumberofcasesdroppedslowlytoabout2800inAugust,beforelevellingoffat2500fortherestoftheyear.Formales,thefigureswerelowerbutshowedasimilartrendthroughouttheepidemic.
(232words)
Thechartbelowshowsestimatedworldliteracyratesbyregionandbygenderfortheyear2000.
Writeareportforauniversitylecturerdescribingtheinformationbelow.
InthisreportIwilldescribeabarchartthatshowstheestimatedworldilliteracyratesbygenderandregionfortheyear2000.
FirstIwilllookatmaleilliteracyforthe6areasshown.ThelowestrateswereinDevelopedCountries,LatinAmerica/CaribbeanandEastAsia/Oceaniawithratesof1%(approximately),10%and8%(approximately)respectively.Theratesforthenextthreeareasweremuchhigherandquitesimilartoeachother.Sub-SaharanAfrica,theArabStatesandSouthAsiahadratesofapproximately31%,29%and34%.
FemaleilliteracywasmuchhigherrelativelyineachareaexceptLatinAmerica/Caribbeanwhereitwasonlyslightlyhigher.ThelowestratesforfemaleilliteracywereagainDevelopedCountries,LatinAmerica/CaribbeanandEastAsia/Oceaniawithratesofapproximately2%,12%and20%.Againtheratesforthenextthreeareasweremuchhigherandquitesimilartoeachother.Sub-SaharanAfrica,theArabStatesandSouthAsiahadratesofapproximately48%,52%and56%.
Thisendsmyreport.
(168words)
Thechartshowsthenumberofmobilephonesandlandlinesper100peopleinselectedcountries.
Writeareportforauniversitylecturerdescribingtheinformationgiven.
Thegraphshowsthenumberofmobilephonesandlandlinesper100users,forselectedcountries.Overall,mostofthecountriesincludedinthegraphhavemoremobilephonessubscribersthanlandlines.
MostEuropeancountrieshavehighmobilephoneuse.ThebiggestusersofmobilephonesaretheItalians,with88cellphonesper100people.Forexample,Italyhastwiceasmanymobilephonesaslandlines,with88mobilesperhundredpeoplecomparedto45forlandlines.MobilephoneuseislowinCanada,withfewerthan40phonesper100people.Denmarkisalsounusualbecauseithasslightlymorelandlinesthanmobilephones.
However,insomecountries,thenumberoflandlinesishigherthanthenumberofmobilephones.OneexampleistheUSA,wherethenumberofmobiles,at50per100people,ismuchlowerthanthenumberoflandlines,atalmost70perhundred.AsimilarpatterncanbeseeninCanada.ThehighestnumberoflandlinesinthegraphisinDenmark,withabout90per100people.Incontrast,thelowestfiguresforfixedlinesareinItalyandtheUK.
Inconclusion,itseemsthatmobilephoneuseishigherinEuropethaninNorthAm
ThegraphsshowenrolmentindifferentcollegesintheHigherCollegesofTechnologyin1999.
Writeatotalof150-200wordsabouttheinformationinthethreegraphs.
ThechartsshowsstudentenrolmentbygenderandlevelindifferentcollegesoftheHigherCollegesofTechnologycollegesintheUAE.
Therearecleardifferencesinmaleandfemaleenrolment.Femalesoutnumbermeninallthecolleges,withalmost25%morestudentsinDubaiWomen'
scollegethaninDubaiMen'
s.RasAl-KhaimahWomen'
sCollegehasalmost180students,comparedtoonly100intheMen'
scollege.
Femalesalsooutnumbermalesbylevel,withalmostdoublethenumberofmenatHigherDiplomalevel(330comparedto181).OnlyatDiplomaleveldoesthenumberofmenslightlyexceedthatofwomen.
OverhalfthestudentsareinCertificatelevel,withlessthanaquarteratHigherDiplomaorBachelorlevel.
Inconclusion,moststudentsintheHigherCollegesareenrolledatDiplomalevelorbelow,andthemajorityofstudentsarewomen.
(143words)
ThelinegraphbelowshowsthenumberofannualvisitstoAustraliabyoverseasresidents.Thetablebelowgivesinformationonthecountryoforiginwherethevisitorscamefrom.Writeareportforauniversitylecturerdescribingtheinformationgiven.
NUMBEROFVISITORS(million)
1975
2005
SOUTHKOREA
JAPAN
CHINA
USA
BRITAIN
EUROPE
2.9
3.2
0.3
0.4
0.9
1.1
9.1
12.0
0.8
1.1
4.5
Total
8.8
30.4
ThegivenlinegraphillustratesinformationonthenumberofoverseasvisitorstravelingtoAustraliainmillionsofpeople.Overall,onenotabletrendseemstobethatAustraliahassteadilybecomemorepopularasadestinationspot.Forexample,therewere20millionmorevisitorstoAustraliain2005thanin1975.That'
sajumpfrom10millionto30millionin20years.
ThesecondtablegivesstatisticsshowingthecountrieswhoseresidentswenttoAustraliabetween1975and2005.Inbothyears,thelargestnumberofvisitorscamefromJapan,followedbySouthKoreaandEurope.Britain,theUnitedStatesandChinaalsohadmanypeopletravelingtoAustraliaintheseyears.Infact,thenumberofpeoplevisitingAustraliagrewineveryoneofthesecountries.Forexample,in2005,12millionpeoplewenttherefromJapancomparedwithonly3.2millionin1975.
(147words)
 升级会员
升级会员 