MATLAB绘图命令.docx
《MATLAB绘图命令.docx》由会员分享,可在线阅读,更多相关《MATLAB绘图命令.docx(30页珍藏版)》请在冰点文库上搜索。
MATLAB绘图命令
快速绘图函数:
>>y=inline('cos(x)*exp(x)');
>>k=feval(y,2)
k=
-3.0749
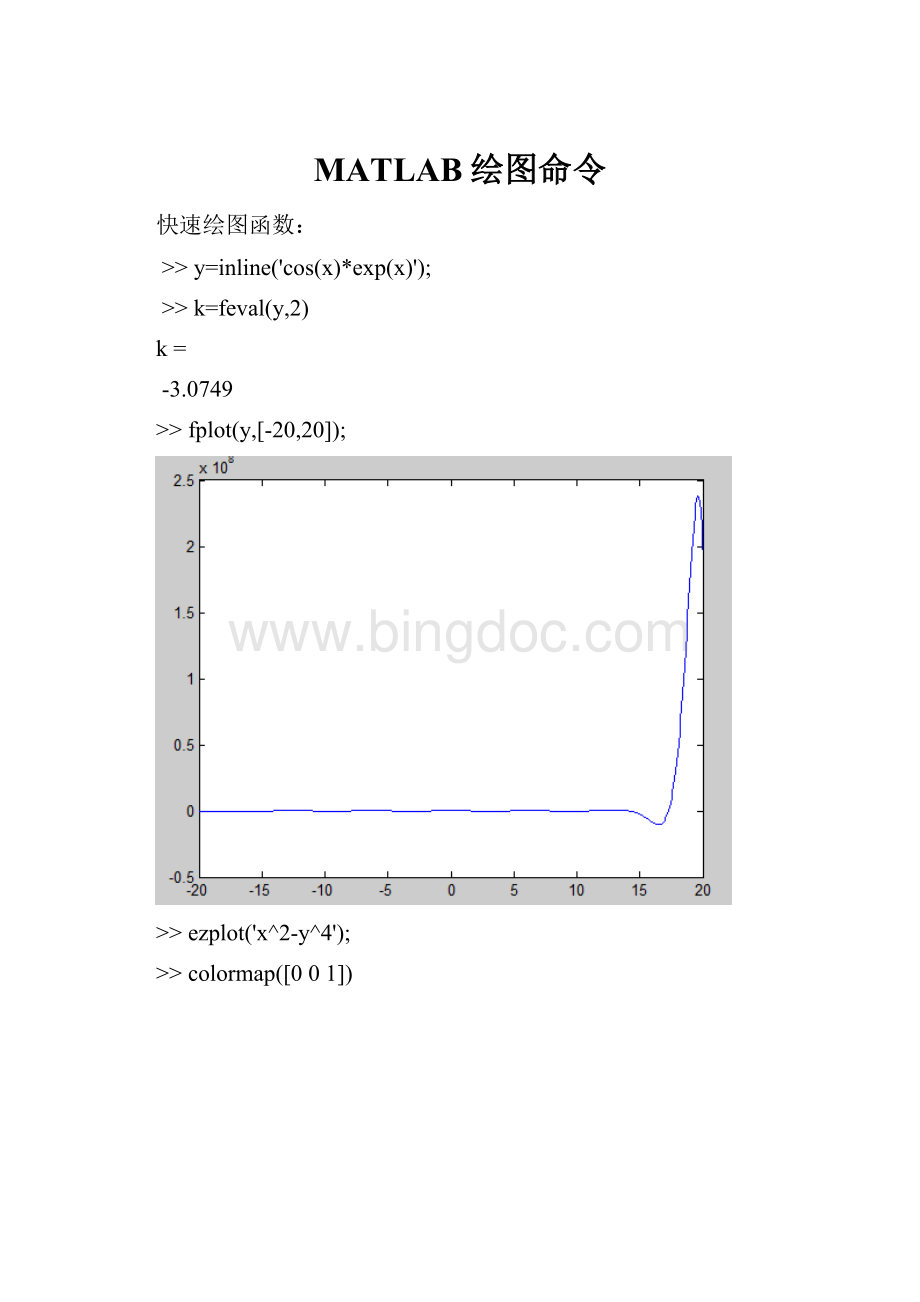
>>fplot(y,[-20,20]);
>>ezplot('x^2-y^4');
>>colormap([001])
绘制子图:
>>subplot(2,2,[13])
>>subplot(2,2,2)
>>subplot(2,2,4)
>>subplot(2,2,1:
2)
>>subplot(2,2,1:
2)
>>subplot(2,2,3)
>>subplot(2,2,4)
图形叠加:
>>x=0:
0.4:
4*pi;
>>y1=exp(-0.1*x).*sin(x);
>>y2=exp(-0.1*x).*sin(x+1);
>>plot(x,y1,'m+');
>>holdon;
>>plot(x,y2,'r--');
>>holdoff;
双y轴绘图:
>>x=0:
0.01:
20;
>>y1=200*exp(-0.05*x).*sin(x);
>>y2=0.8*exp(-0.5*x).*sin(10*x);
>>[ax,h1,h2]=plotyy(x,y1,x,y2,'plot');
>>set(get(ax
(1),'ylabel'),'string','slowdecay')
>>set(get(ax
(2),'ylabel'),'string','fastdecay')
>>set(h1,'linestyle','--')
>>set(h2,'linestyle',':
');
三维绘图:
三维曲线图:
>>[x,y]=meshgrid(-8:
.5:
8);
>>r=sqrt(x.^2+y.^2)+eps;
>>z=sin(r)./r;
>>mesh(x,y,z)
三维等高线图:
>>[x,y]=meshgrid(-3:
.125:
3);
>>z=peaks(x,y);
>>meshc(x,y,z);
>>axis=([-33-33-1010])
>>[x,y]=meshgrid(-3:
.125:
3);
>>z=peaks(x,y);
>>meshz(x,y,z);
三维曲面图:
>>k=5;
>>n=2^k-1;
>>[x,y,z]=sphere(n);
>>c=hadamard(2^k);
>>surf(x,y,z,c);
>>colormap([110;011]);
>>axisequal;
>>[x,y,z]=peaks(30);
>>surfc(x,y,z);
>>colormaphsv;
>>axis([-33-33-105])
>>surfl(x,y,z);
>>shadinginterp;
>>surfnorm(x,y,z);
背景颜色设置:
>>subplot(2,2,1);colordefnone;
>>surf(peaks(36));
>>subplot(2,2,2);colordefblack;
>>surf(peaks(36));
>>subplot(2,2,3:
4);colordefwhite;
>>surf(peaks(36));
>>loadflujet;
>>image(X);
>>colormap(bone);
>>figure;image(X);
>>colormap(jet)
>>loadcape;
>>colormap(map)
>>subplot(2,2,1)
>>image(X,'CDataMapping','scaled')
>>axisimage;
>>subplot(2,2,2)
>>image(X,'CDataMapping','scaled')
>>axisimage;
>>caxis([3192])
>>subplot(2,2,3)
>>image(X,'CDataMapping','scaled')
>>axisimage;
>>caxis([5192])
>>subplot(2,2,4)
>>image(X,'CDataMapping','scaled')
>>axisimage;
>>caxis([6192])
>>surf(peaks(30))
>>colorbar('YTickLabel',{'freezing','cold','cool','neutral','warm','hot'})
光照的设置
>>subplot(1,2,1);surf(peaks);
>>light;
>>subplot(1,2,2);surf(peaks);
>>light('color','r','position',[0,1,0],'style','local');
>>set(gcf,'color','w');
>>t=0:
pi/20:
2*pi;
>>[x,y,z]=cylinder(2+cos(t));
>>subplot(2,2,1);mesh(x,y,z);
>>light;lightingphong;
>>subplot(2,2,2);surf(x,y,z);
>>light;shadingfaceted;
>>lightingflat;
>>subplot(2,2,3);surf(x,y,z);
>>light;shadinginterp;
>>lightinggouraud;
>>subplot(2,2,4);surf(x,y,z);
>>light;lightingnone;
>>subplot(1,2,1);sphere;
>>light('color','r','position',[1,0.5,1],'style','local');
>>lightingphong;
>>materialdull;
>>colorbar;
>>axisoff;
>>subplot(1,2,2);sphere;
>>light('color','r','position',[1,0.5,1],'style','local');
>>lightingnone;
>>material([0.30.40.5100.7]);
>>colorbar;
>>axisoff;
透视图:
>>[x,y,z]=ellipsoid(0,0,0,1.5,2.5,5.5);
>>[x0,y0,z0]=sphere(40);
>>surf(x0,y0,z0);shadinginterp;
>>holdon;
>>mesh(x,y,z);colormap(hsv);
>>hiddenoff;
>>axisequal;
>>axisoff;
>>subplot(2,2,1);
>>[x,y,z]=peaks(40);
>>surf(x,y,z);shadinginterp;
>>alpha(x);
>>subplot(2,2,2);
>>surf(x,y,z);shadinginterp;
>>alpha(y);
>>subplot(2,2,3);
>>surf(x,y,z);shadinginterp;
>>alpha(z);
>>subplot(2,2,4);
>>surf(x,y,z);shadinginterp;
>>alpha(z);alpha('interp');
>>alphamap('vdown');
特殊图形:
1.条形图
>>y=[75:
100];
>>subplot(2,2,1);bar(y,'grouped');
>>subplot(2,2,2);bar(y,'stacked');
>>subplot(2,2,3);barh(y,'grouped');
>>subplot(2,2,4);barh(y,'stacked');
2.区域图
>>y=[1,5,3;3,2,7;1,5,3;2,6,1];
>>h=area(y,-2);
>>set(h
(1),'FaceColor',[.500])
>>set(h
(2),'FaceColor',[.700])
>>set(h(3),'FaceColor',[100])
>>set(h,'LineStyle',':
','LineWidth',2)
3.饼图
>>x=[130.52.52];
>>explode=[01000];
>>subplot(1,2,1);pie(x,explode)
>>colormapjet;
>>subplot(1,2,2);pie3(x,explode)
>>colormaphsv;
4.离散数据杆状图
>>t=linspace(-2*pi,2*pi,10);
>>subplot(1,2,1);stem(t,cos(t));
>>subplot(1,2,2);h=stem(t,cos(t),'fill','--');
>>set(get(h,'baseline'),'linestyle',':
')
>>set(h,'markerfacecolor','red','marker','square');
>>t=0:
.1:
10;
>>s=0.1+i;
>>y=exp(-s*t);
>>stem3(real(y),imag(y),t)
>>holdon;
>>plot3(real(y),imag(y),t,'r')
>>holdoff;
>>view(-39.5,62);
5.阶梯图
>>alpha=0.01;
>>beta=0.5;
>>t=0:
10;
>>f=exp(-alpha*t).*sin(beta*t);
>>stairs(t,f)
>>holdon;
>>plot(t,f,'--*')
>>holdoff;
6.矢量图
>>t=0:
.01:
2*pi;
>>x=cos(2*t).*(cos(t).^2);
>>y=sin(2*t).*(sin(t).^2);
>>comet(x,y);
>>t=-10*pi:
pi/250:
10*pi;
>>comet3((cos(2*t).^2).*sin(t),(sin(2*t).^2).*cos(t),t);
>>wdir=[45909045360335360270335270335335];
>>knots=[668639689101412];
>>rdir=wdir*pi/180;
>>[x,y]=pol2cart(rdir,knots);
>>subplot(1,2,1);compass(x,y);
>>subplot(1,2,2);
>>theta=90:
-10:
0;
>>r=ones(size(theta));
>>[u,v]=pol2cart(theta*pi/180,r*10);
>>feather(u,v);
>>[x,y]=meshgrid(-2:
.2:
2);
>>z=x.*exp(-x.^2-y.^2);
>>[dx,dy]=gradient(z,.2,.2);
>>subplot(1,2,1);contour(x,y,z)
>>holdon;
>>quiver(x,y,dx,dy)
>>colormaphsv;
>>subplot(1,2,2);
>>[x,y]=meshgrid(-2:
0.25:
2,-1:
0.2:
1);
>>z=x.*exp(-x.^2-y.^2);
>>[u,v,w]=surfnorm(x,y,z);
>>quiver3(x,y,z,u,v,w,0.5);
>>holdon;
>>surf(x,y,z);
>>colormaphsv;
>>view(-35,45)
 升级会员
升级会员 