雅思经典图表作文范文.docx
《雅思经典图表作文范文.docx》由会员分享,可在线阅读,更多相关《雅思经典图表作文范文.docx(16页珍藏版)》请在冰点文库上搜索。
雅思经典图表作文范文
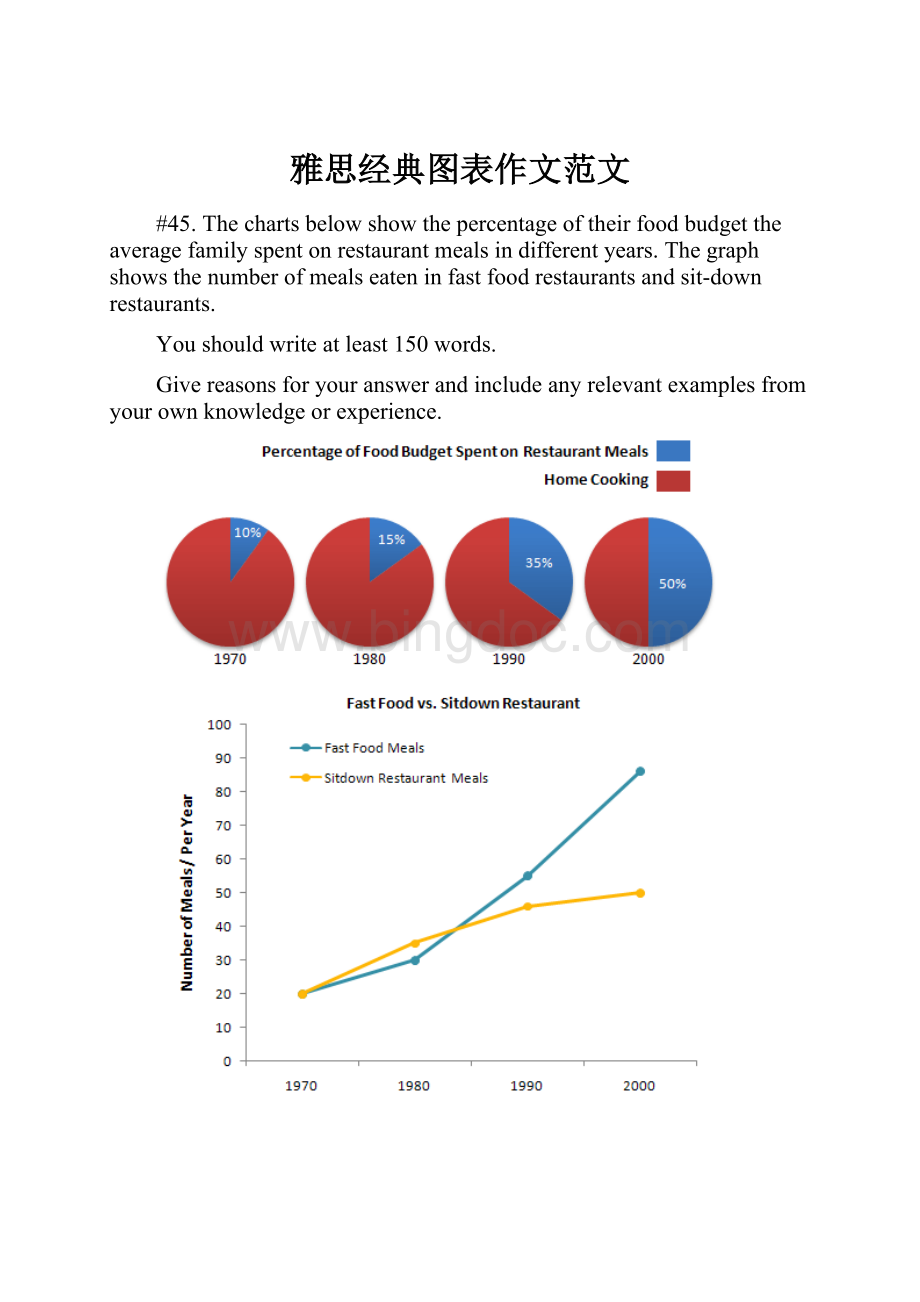
#45.Thechartsbelowshowthepercentageoftheirfoodbudgettheaveragefamilyspentonrestaurantmealsindifferentyears.Thegraphshowsthenumberofmealseateninfastfoodrestaurantsandsit-downrestaurants.
Youshouldwriteatleast150words.
Givereasonsforyouranswerandincludeanyrelevantexamplesfromyourownknowledgeorexperience.
Overthepast30years,theaveragefamilyhasdramaticallyincreasedthenumberofmealsthattheyeatatrestaurants.Thepercentageofthefamily'sfoodbudgetspentonrestaurantmealssteadilyclimbed.Just10percentofthefoodbudgetwasspentonrestaurantmealsin1970,and15percentin1980.Thatpercentagemorethandoubledin1990,to35percent,androseagainin2000to50percent.
Wherefamilieseattheirrestaurantmealsalsochangedduringthat30-yearperiod.In1970,familiesatethesamenumberofmealsatfastfoodandsit-downrestaurants.In1980,fam¬iliesateslightlymorefrequentlyatsit-downrestaurants.However,since1990,fastfoodrestaurantsservemoremealstothefamiliesthandothesit-downrestaurants.Mostoftherestaurantmealsfrom2000wereeatenatfastfoodrestaurants.Ifthispatterncontinues,eventuallythenumberofmealsthatfamilieseatatfastfoodrestaurantscoulddoublethenumberofmealstheyeatatsit-downrestaurants.
(164words)
#44.Youshouldspendabout20minutesonthistask.
ThemapbelowisofthetownofGarlsdon.Anewsupermarket(S)isplannedforthetown.Themapshowstwopossiblesitesforthesupermarket.
Summarisetheinformationbyselectingandreportingthemainfeatures,andmakecomparisonswhererelevant.
Youshouldwriteatleast150words
modelanswer:
Thefirstpotentiallocation(S1)isoutsidethetownitself,andissitedjustoffthemainroadtothetownofHindon,lying12kmstothenorth-west.Thissiteisinthecountrysideandsowouldbeabletoaccommodatealotofcarparking.ThiswouldmakeitaccessabletoshoppersfrombothHindonandGarlsdonwhocouldtravelbycar.AsitisalsoclosetotherailwaylinelinkingthewhotownstoCransdon(25kmtothesouth-east),apotentiallylargenumberofshopperswouldalsobeabletotravelbytrain.
Incontrast,thesuggestedlocation,S2,isrightinthetowncentre,whichwouldbegoodforlocalresidents.Theoricallythestorecouldbeaccessedbyroadorrailfromthesurroundingtowns,includingBransdon,butasthecentralareaisano-trafficzone,carswouldbeunabletoparkandaccesswouldbedifficult.
Overall,neithersiteisappropriateforallthetowns,butforcustomersinCransdon,HindonandGarlsdon,theout-of-townsite(S1)wouldprobablyoffermoreadvantages.
(179words)
#43.Youshouldspendabout20minutesonthistask.
ThetablebelowshowsCO2emissionsfordifferentformsoftransportintheEuropeanUnion.
ThePieChartshowsthepercentageofEuropeanUnionfundsbeingspentondifferentformsoftransport.
Youshouldwriteatleast150words.
modelanswer:
ThechartshowsCO2emissionsperpassengerkilometreforvariuosmethodsoftransportintheEuropeanUnionwhilethepiechartshowsEuropeanUnionspendingontransport.FlyingbyairproducesbyfarthegreatestCO2emissions,approximatelythreetimesasmuchaspassengercarswhicharethenextlargestproducers.VerylittleisspentbytheEUonairtravelwhileroadsmakeupmorethanhalfoftheEUtransportbudget.
TrainsproduceaboutthreetimeslessCO2emissionsperpassengerkilometrethanpassengercarsandeighttimeslessthanairtravel.NearlyathirdofEUtransportfundsarespentonrailways.
ShipsareacleanformoftransportandproduceaboutthesameamountofCO2perpassengerkilometreastrainsdo.However,only2percentofEUfundsarespentonports.Afurtheronepercentisspentoninlandwaterways.
Coachesarethecleanestformoftransport.EmissionsofCO2perpassengerkilometrefromcoachesarehalfthoseofbuses.BusesemitlessthanhalfasmuchCO2perpassengerkilometreascars.TheEuropeanUnionspends10percentofitstransportbudgetonpublictransport,suchasbusesandcoaches.
(197words)
#41.Youshouldspendabout20minutesonthistask.
Thetablebelowshowsthesalesatasmallrestaurantinadowntownbusinessdistrict.
Summarizetheinformationbyselectingandreportingthemainfeatures,andmakecomparisonswhererelevant.
Youshouldwriteatleast150words.
Givereasonsforyouranswerandincludeanyrelevantexamplesfromyourownknowledgeorexperience.
Sales:
weekofOctober7-13
Mon.
Tues.
Wed.
Thurs.
Fri.
Sat.
Sun.
Lunch
$2,400
$2,450
$2,595
$2,375
$2,500
$1,950
$1,550
Dinner
$3,623
$3,850
$3,445
$3,800
$4,350
$2,900
$2,450
modelanswer:
ThesalesatthissmallrestaurantduringtheweekofOctober7to13thfollowedafairlysetpatternfromMondaytoFriday,andthenshowednotableshiftontheweekend.ThelunchanddinnersalesduringtheweekpeakedonFridayandthendipperdownastheweekendsetin.
DuringtheweekofOctober7-14th,thelunchsalesaveragedatapproximately$2,400.ThehighestlunchsalesoccurredonFriday,andthelowestoccurredonSunday.Sunday'slunchsaleswereapproximately$1,000lessthantheaveragelunchsalesduringtherestoftheweek.
Dinnersales,whichgeneratedatleast$1,000to$1,500moreadaythanlunchsales,alsoremainedsteadyduringtheweek.Justlikethelunchsales,thedinnersalespeakonFridayanddippeddownfortheweekend.
ExcludingWednesdayandThursday,thelunchanddinnersalesfromOctober7-11rosegraduallyuntiltheendofthebusinessweek.Midweek,onWednesdayandThursday,thesaleswereslightlylowerthantheywereonTuesday.
Accordingtothesalesreport,thisrestauranthasasteadylunchanddinnercrowd.ThemostprofitabledayduringthesecondweekofOctoberwasFriday.Sunday,wastheleastprof¬itableday,withthefullday'ssalestotaling/totallinglessthantheFridaydinnersales.Thesenumbersarereflectiveofarestaurantthatislocatedinabusiness/financialdistrictwherebusinesshoursareMondaythroughFriday.
#40.Youshouldspendabout20minutesonthistask.
InJune1996,anexperimentalfluvaccinewastrialledinalargecountrytownonfemalesonly.
Summarisetheinformationbyselectingandreportingthemainfeatures,andmakecomparisonswhererelevant.
Youshouldwriteatleast150words.
Givereasonsforyouranswerandincludeanyrelevantexamplesfromyourownknowledgeorexperience.
modelanswer:
Thediagramsshowdataforafluepidemicwhichhitalargecountrytownin1996.Figure1givesthenumberofpersonswhodied;Figure2showsthepercentagebreakdownoffemaleswhoreceivedanewfluvaccine;andFigure3givesthenumberofcasesofflubeforeandduringtheepidemic.
InFigure1itcanbeseenthatthefluwasresponsibleforthedeathsof2femalesbutnomalesintheperiodfromMarchtoMay.However,fromJunetoAugust,therewere4femaledeathsand1maledeath.
AccordingtothepiechartinFigure2,onlythosefemalesmostatriskweregiventhenewfluvaccine;28%didnottakepartinthetrial.Ofthosefemaleswhotookpart,35%wereaged(over65yearsold);24%werebabiesorchildren;and13%wereeitherhospitalisedorreceivingothermedicalattention.
FromFigure3itisclearthatthenewvaccinehadapositiveeffectonthenumberofnewcasesofflureportedinfemales.Therewerejustover1000casesreportedinMarch,climbingrapidlytoapeakof3500inJune.Thereafter,thenumberofcasesdroppedslowlytoabout2800inAugust,beforelevellingoffat2500fortherestoftheyear.Formales,thefigureswerelowerbutshowedasimilartrendthroughouttheepidemic.
(232words)
#39.Youshouldspendabout20minutesonthistask.
Thechartbelowshowsestimatedworldliteracyratesbyregionandbygenderfortheyear2000.
Writeareportforauniversitylecturerdescribingtheinformationbelow.
Youshouldwriteatleast150words.
modelanswer:
InthisreportIwilldescribeabarchartthatshowstheestimatedworldilliteracyratesbygenderandregionfortheyear2000.
FirstIwilllookatmaleilliteracyforthe6areasshown.ThelowestrateswereinDevelopedCountries,LatinAmerica/CaribbeanandEastAsia/Oceaniawithratesof1%(approximately),10%and8%(approximately)respectively.Theratesforthenextthreeareasweremuchhigherandquitesimilartoeachother.Sub-SaharanAfrica,theArabStatesandSouthAsiahadratesofapproximately31%,29%and34%.
FemaleilliteracywasmuchhigherrelativelyineachareaexceptLatinAmerica/Caribbeanwhereitwasonlyslightlyhigher.ThelowestratesforfemaleilliteracywereagainDevelopedCountries,LatinAmerica/CaribbeanandEastAsia/Oceaniawithratesofapproximately2%,12%and20%.Againtheratesforthenextthreeareasweremuchhigherandquitesimilartoeachother.Sub-SaharanAfrica,theArabStatesandSouthAsiahadratesofapproximately48%,52%and56%.Thisendsmyreport.
#38.Youshouldspendabout20minutesonthistask.
Thechartshowsthenumberofmobilephonesandlandlinesper100peopleinselectedcountries.
Writeareportforauniversitylecturerdescribingtheinformationgiven.
Youshouldwriteatleast150words.
modelanswer:
Thegraphshowsthenumberofmobilephonesandlandlinesper100users,forselectedcountries.Overall,mostofthecountriesincludedinthegraphhavemoremobilephonessubscribersthanlandlines.
MostEuropeancountrieshavehighmobilephoneuse.ThebiggestusersofmobilephonesaretheItalians,with88cellphonesper100people.Forexample,Italyhastwiceasmanymobilephonesaslandlines,with
 升级会员
升级会员 