价格形态百科三重顶底2.docx
《价格形态百科三重顶底2.docx》由会员分享,可在线阅读,更多相关《价格形态百科三重顶底2.docx(23页珍藏版)》请在冰点文库上搜索。
价格形态百科三重顶底2
42、TripleBottoms
RESULTSSNAPSHOT
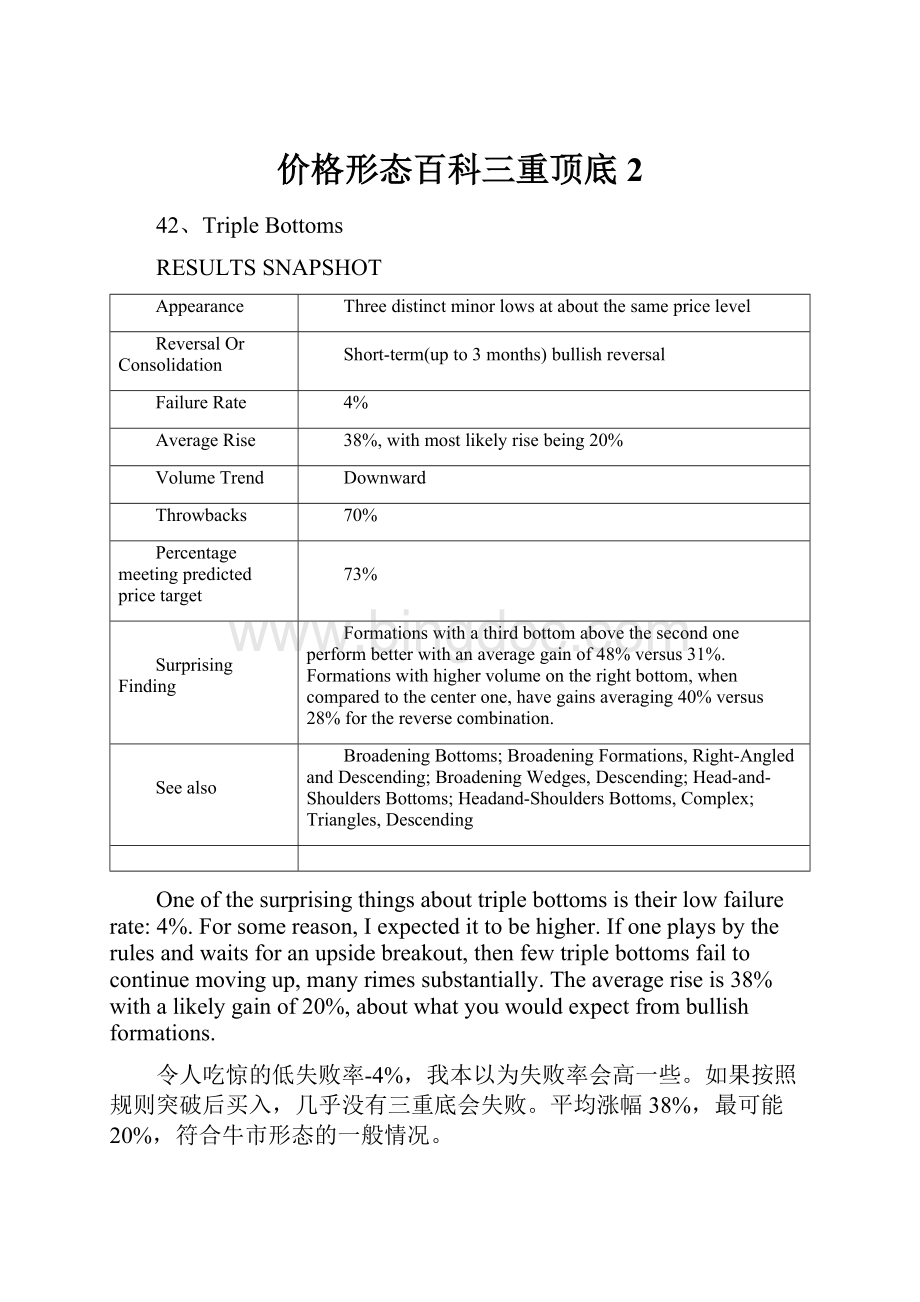
Appearance
Threedistinctminorlowsataboutthesamepricelevel
ReversalOrConsolidation
Short-term(upto3months)bullishreversal
FailureRate
4%
AverageRise
38%,withmostlikelyrisebeing20%
VolumeTrend
Downward
Throwbacks
70%
Percentagemeetingpredictedpricetarget
73%
SurprisingFinding
Formationswithathirdbottomabovethesecondoneperformbetterwithanaveragegainof48%versus31%.Formationswithhighervolumeontherightbottom,whencomparedtothecenterone,havegainsaveraging40%versus28%forthereversecombination.
Seealso
BroadeningBottoms;BroadeningFormations,Right-AngledandDescending;BroadeningWedges,Descending;Head-and-ShouldersBottoms;Headand-ShouldersBottoms,Complex;Triangles,Descending
Oneofthesurprisingthingsabouttriplebottomsistheirlowfailurerate:
4%.Forsomereason,Iexpectedittobehigher.Ifoneplaysbytherulesandwaitsforanupsidebreakout,thenfewtriplebottomsfailtocontinuemovingup,manyrimessubstantially.Theaverageriseis38%withalikelygainof20%,aboutwhatyouwouldexpectfrombullishformations.
令人吃惊的低失败率-4%,我本以为失败率会高一些。
如果按照规则突破后买入,几乎没有三重底会失败。
平均涨幅38%,最可能20%,符合牛市形态的一般情况。
Almostthreeoutoffourformations(70%)throwbacktothebreakoutpoint.Thisissomewhatmisleadingbecausethebreakoutpointcanbefarremovedfromthefinaltrough—anaverageofalmost6weeksaway.Butthetimeiswellspentaspricesclimbfromthethirdrecessiontothebreakoutorconfirmationpoint.
70%的三重底突破后会回调。
Justforkicks,Imeasuredtheaveragegainforthoseformationswithathirdbottomabovethelowpostedbythesecondone.Thegainis48%,whereasthosewithathirdbottombelowthesecondonescoregainsaveragingjust31%.Thedifferencesarestatisticallysignificantbutitmaysurpriseyoutolearntheaveragepricedifferencebetweenthetwobottomsisonly35cents.Volumeisimportanttoperformance.Whenthevolumeonthecenterbottomisbelowthatofthelastbottom,theformationshavegainsaveraging40%.Withthereversesituationwherethecenterbottomhasthehighervolumeofthetwo,performancedwindlesto28%.Iexplorestatisticslaterinthischapter.
Tour
Figure42.1showsanexampleofatriplebottom.Pricesdescendtothe37areathreetimesandeachtime,theyturnaway;thelevelmarksazoneofsupportpreventingfuturedeclines.ThesharpV-shapedrecession,especiallyduringthelastvalley,istypicalfortriplebottoms.Therounded-lookingrisefromthefirstvalleytothesecondisalsocharacteristicoftriplebottomsbutnotastrictrequirement.
图42.1是一个典型的三重底。
价格从三次跌至37美元区域,每次都反转。
这个区域标志着强烈的支撑。
第三次的V形反转,第二次的圆形上涨,都是三重底的典型特征,不过不是严格要求。
Thepricelevelofthethreevalleysisnearlythesame,inthiscase,within3/8ofoneanother.ThatisakeyelementoftriplebottomsasweseeintheIdentificationGuidelinessection.
三个价格底部的价格水平是近似的,在本例中,3/8美元以内。
这是三重底的重要规定。
Eachchartformationisuniquewithcharacteristicsthatdistinguishitfromotherpatterns,andtheoneinFigure42.1isnoexception.Thestockreachesalowinmid-October1992,aftertrendingdownfor5months.Thenpricesretracetheirlossesandstrayintonewhighterritorybeforeheadingdowntothefirsttriplebottomlow.SupportreachedduringformationofthefirstlowissetupbythepeakbackinMay1992.Pricesclimbtothe37areaseveraltimesfromJanuarytoMaybutfailtoburstthroughtheresistance.
每种形态都是独一无二的区别于其他形态的,图42.1中也不例外。
股票在下跌5个月后,于1992年十月中旬达到低谷。
然后回调,运动到高价区域,之后跌倒第一个低谷。
之后往复运动,多次触及。
Themultiplehitsontheceilingareinnosmallmeasureresponsibleforthesupportthetriplebottomencounters.Aspricesdescendto37,investorswillingtopartwiththeirsharesatthelowerlevelarescarce.Whensomeonedoesoffertosell,buyerssnatchthestockbelievingtheyaregettingagoodbargain.Andtheyareright.Pricesdonotmeanderatthe37levelforlong.IfyoulookcloselyatFigure42.1,eachvalleyfloorisa1-daydownwardspike,albeitsmallbutvisible.
Thestartoftheformation,fromthefirsttothesecondbottom,lookslikeabroadeningtop,right-angledandascendingwithitshorizontalbottomandup-slopingtoptrendline.However,therearenotenoughpricecrossingstoreallyvalidatetheformation.ItalwaysmakesmenervouswhenIseeplentyofwhitespaceinaformation(suchasthatshownbetweenthefirstandsecondbottoms).Whentherisebetweenthesecondandthirdtroughsfailstocomeanywhereneartheup-slopingtrendline,thejigisup.
形态开始阶段,看起来像上升三角喇叭形。
然后,价格往复太少,无法确认形态(空白区域太大)。
Pricesstoprisingatthesamepoint,about46,makingthetriplebottomlooklikeadoubletop.This,too,failstocometofruitionwhenpricesreachthe37supportzoneandturnaround.Thedoubletopremainsunconfirmedanditjustbecomesanothertwobumpsonthepricechart.
Theconvolutedcreationofatriplebottomhelpsexplainwhytheformationissoscarce,butIdiscussstatisticslater.First,howdoyouidentifyatriplebottom?
IdentificationGuidelines
Table42.1outlinestheguidelinesforidentifyingtriplebottoms.Ithinkmosttechnicalanalystswilltellyouthatnotanythreebottomswilldoforatriplebottom.Thethreebottomsareusuallylargeandwellseparatedwithgenerallyroundedrisesinbetween.Thelowestpriceineachbottomisataboutthesamelevel.Ifthecenterpriceislowerthantheothertwo,thenyoumightbelookingatahead-and-shouldersbottom.Whenthebottomsaresuccessivelylowerinprice,itmightbeoneofthebroadeningseriesofformations(broadeningbottoms;broadeningformations,right-angledanddescending;broadeningformations,right-angledandascendingifthebottomsareflatbutthetopsformsuccessivelyhigherpeaks;andbroadeningwedges),soconsulttheappropriatechapteronthoseformations.
Thevolumetrendusuallyrecedesoverthecourseoftheformation.Sincetheformationtendstobelong,thevolumepatternappearsraggedorirregularattimes.Eachofthethreebottomsusuallyshowsvolumethatpeaksabovethedaysleadingtothebottomwiththefirstbottomusuallyhavingthehighestvolumeofthetrio.IntheStatisticssectionofthischapterwedelveintothevolumepatternmorethoroughly.
Nowthatwehavereviewedmostoftheguidelines,whatdoesatriplebottomlooklike?
Figure42.2showsagoodexampleofatriplebottom.Noticethethreedownwardpricerecessions.Theyaredistinctandseparatedwiththerallybetweeneachbottomquitepronounced.Pricesrisefromthelowofabout35totheconfirmationlinejustover40.Theconfirmationlineisthehighesthighreachedduringthechartpattern.Itservesasthebreakoutpoint,thepointtowhichpricesmustrisebeforeanythreeminorlowsbecomeatruetriplebottom.Whenpricesriseabovetheconfirmationline,theformationconfirmsandpricesshouldcontinuerising.
YoucanseeinFigure42.2diatthethreebottomsareatnearlydiesameprice.Onlythelastbottomfallsshortofthegoal.AsweseeintheStatisticssection,diisoftensignalsabetterperformingformation.Thistriplebottomisthebeginningofalarge,extendedmovehattakespricesfromalowof34!
/2toahighof73'/2in16months.
Thevolumetrendindiisformationisdownwardwithdielargestconcentrationofhighvolumeondiefirstbottom.ThecenterbottomhassubduedvolumeandisevenloweronthediirdbottominearlyOctober.Volumespikesupwardaspricesrisetotheconfirmationpointinmid-November.Then,pricesconsolidateforaboutaweekbeforeattemptingtopiercedieoldresistancelineat40'/2.Onaboveaveragevolume,pricespushthroughtheoldbarrierandquicklyjumpthreepoints,buildabroadeningtopformation,diencontinuehigher.
TriplebottomsareusuallylargeenoughtobevisibleonweeklychartssuchasthatshowninFigure42.3.Thethreeminorlowsareevidentindieweeklychart.ThefirstrallypeakinginearlyMaymarksdiehighpointthatlaterbecomestheconfirmationlevel.Theclimbbetweendiesecondandthirdbottomissuspiciouslyflat,butrarelydoesanychartpatternfittheidealshape.Indiisinstance,eachbottomissuccessivelylowerdianthepriorone.Alowerlowpriceondielastbottomisacluetoimpendingunderperformance.Thatisexactlywhathappensaspricesclimbabovedieconfirmationpointof213/storeachahighof26beforeheadingbackdown.Aldioughdie22%gainisbelowaverage,itisstillbetterthantakingaloss.
Investorsnotsellingatthehighseetheirinvestmentdwindleto173/sbylateApril1994.Iftheyholdtheirshares,thestockreboundsanddoesmuchbetter,toppingoutat66l/iinearlyMarch1996.
ThethrowbacktotheconfirmationlinecouldencompassanynumberofweeksbeginninginlateOctober1993.Pricespiercetheconfirmationline,movingup,thenthrowbacktoitwithinamonth.Pricesreturningtotheconfirmationlinebeyondthe30-daytimelimitclassifyasnormalpriceaction,notthrowbacks.
FocusonFailures
Oncepricesreachdieconfirmationline,theyusuallyhavebeenrisingforwelloveramonth,onaverage,sincethethirdbottom.Pricesoftenpiercedieresistancelinebutdoubleback,hesitatingbeforecontinuingup—mostofthetime.Insomecases,pricesriseabovetheconfirmationpointbylessthan5%beforethrowingbackandcontinuingdown.Whenthathappens,itiscalleda5%failure.Inthisstudyoftriplebottoms,allchartpatternsmuststageanupsidebreakout(ariseabovediehighesthighintheformation)beforebeinglabeledatriplebottom.Sinceallformationshaveupsidebreakouts,only5%failuresremaintowipethewarmglowofasuccessfulinvestmentfromanoviceinvestor'sface.Fortunately,5%failuresarerare.Onlyfive(4
 升级会员
升级会员 