matlab答案第五章.doc
《matlab答案第五章.doc》由会员分享,可在线阅读,更多相关《matlab答案第五章.doc(8页珍藏版)》请在冰点文库上搜索。
第五章
1.绘制下列曲线。
(1)
(2)
(3)(4)
答:
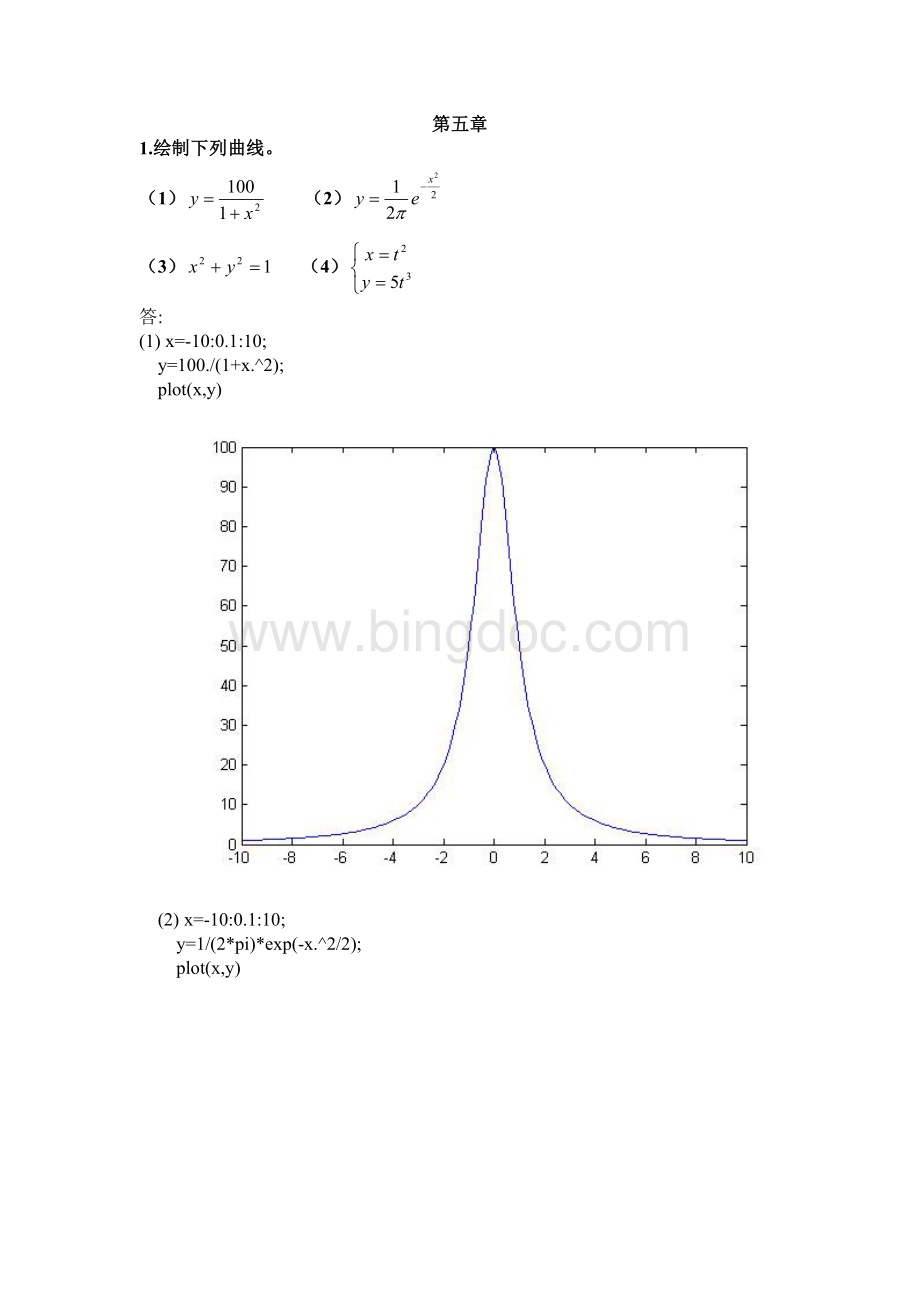
(1)x=-10:
0.1:
10;
y=100./(1+x.^2);
plot(x,y)
(2)x=-10:
0.1:
10;
y=1/(2*pi)*exp(-x.^2/2);
plot(x,y)
(3)ezplot('x^2+y^2=1')
(4)
t=-10:
0.1:
10;
x=t.^2;
y=5*t.^3;
plot(x,y)
2.绘制下列三维图形。
(1)
(2)
(3) (4)半径为10的球面(提示:
用sphere函数
答:
(1)
t=0:
pi/100:
2*pi;
x=cos(t);
y=sin(t);
z=t;
plot3(x,y,z)
(2)
u=0:
pi/100:
2*pi;
v=0:
pi/100:
2*pi;
x=(1+cos(u)).*cos(v);
y=(1+cos(u)).*sin(v);
z=sin(u);
plot3(x,y,z)
(3)
[x,y]=meshgrid(-100:
100);
z=5*ones(size(x));
mesh(x,y,z)
(4)
[x,y,z]=sphere;%等价于sphere(20)20是画出来的球面的经纬分面数...20的话就是20个经度,20个纬度,或者说“就是划出20╳20面的单位球体,把球的表面分成400个小网格”
surf(x,y,z);%绘制单位球面
x=10*x;
y=10*y;
z=10*z;
surf(x,y,z);%绘制半径为10的球面
axisequal
3.在同一图形窗口中采用子图形式分别绘制正方形、圆、三角形和六边形。
答:
n=[3462^10]
fori=1:
4
subplot(2,2,i)
theta=linspace(pi/n(i),2*pi+pi/n(i),n(i)+1);
plot(cos(theta),sin(theta));
axisequal;
end
4.分别用plot和fplot绘制下列分段函数的曲线。
答:
plot函数:
方法一:
x=linspace(-10,10,200);
y=[];
forx0=x
ifx0>0
y=[y,x0.^2+(1+x0).^(1/4)+5];
elseifx0==0
y=[y,0];
elseifx0<0
y=[y,x0.^3+sqrt(1-x0)-5];
end
end
plot(x,y)
方法二:
x=linspace(-10,10,200);
y=(x<0).*(x.^3+sqrt(1-x)-5)+(x==0).*0+(x>0).*(x.^2+(1+x).^(1/4)+5);
plot(x,y)
用fplot函数:
fplot('(x<0).*(x.^3+sqrt(1-x)-5)+(x==0).*0+(x>0).*(x.^2+(1+x).^(1/4)+5)',[-10,10])
5.在同一坐标轴中绘制下列两条曲线并标注两曲线的交叉点。
(1)
(2)
答:
相邻两点x1、x2曲线
(1)相应的y值为y11、y12,曲线
(2)y相应的y值y21、y22,若(y11-y21)与(y12-y22)符号相反或等于0,则x1或x2就是一个交叉点。
方法一:
t=linspace(0,pi,300);
x=sin(3*t).*cos(t);
y1=2*x-0.5;
y2=sin(3*t).*sin(t);
len=length(t);
p=y1-y2;
x3=x((find(p(1:
len-1).*p(2:
len)<=0)));
y3=2*x3-0.5;
plot(x,y1,x,y2,x3,y3,'rd')
方法二:
用循环
%t=0:
0.01:
pi;
t=linspace(0,pi,100);
x=sin(3*t).*cos(t);
y1=2*x-0.5;
y2=sin(3*t).*sin(t);
plot(x,y1,x,y2);grid;
delta_y=y1-y2;
%figure;stem(delta_y);
j=1;
fori=1:
length(t)-1
ifdelta_y(i)*delta_y(i+1)<=0
position(j)=i+1;
j=j+1;
end
end
holdon;
plot(x(position),y1(position),'ro');
title('两条曲线相交');
xlabel('x');ylabel('y');
h=legend('y1','y2');
 升级会员
升级会员 