计量经济学多元线性回归模型.docx
《计量经济学多元线性回归模型.docx》由会员分享,可在线阅读,更多相关《计量经济学多元线性回归模型.docx(15页珍藏版)》请在冰点文库上搜索。
计量经济学多元线性回归模型
计量经济学·多元线性回归模型
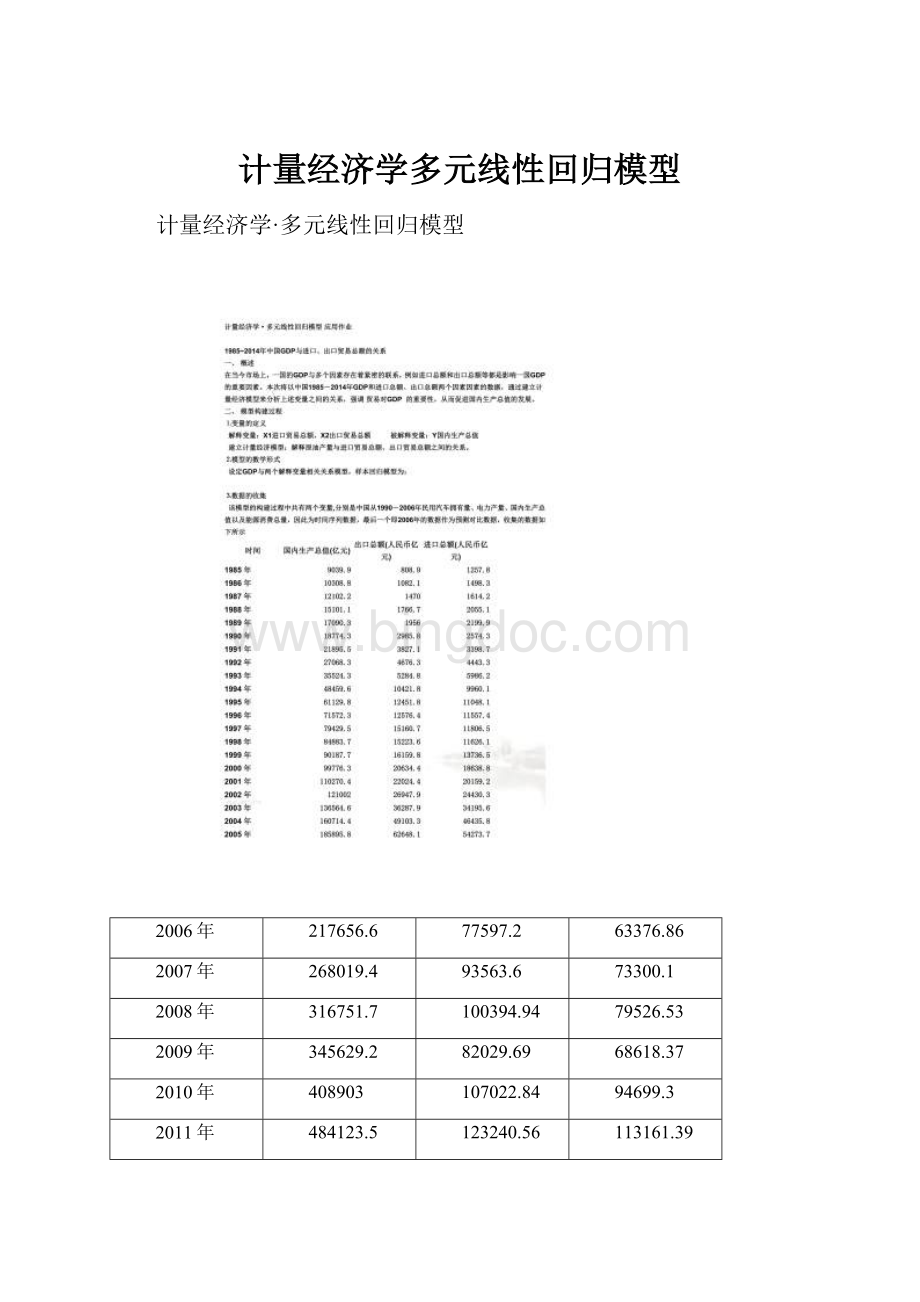
2006年
217656.6
77597.2
63376.86
2007年
268019.4
93563.6
73300.1
2008年
316751.7
100394.94
79526.53
2009年
345629.2
82029.69
68618.37
2010年
408903
107022.84
94699.3
2011年
484123.5
123240.56
113161.39
2012年
534123
129359.3
114801
2013年
588018.8
137131.4
121037.5
2014年
636138.7
143911.66
120422.84
数据来源:
国家统计局
3、模型的检验及结果的解释、评价
(一)OLS法的检验
相关系数:
Y
X1
X2
Y
1
0.9799919175967026
0.983524229450628
X1
0.9799919175967026
1
0.9975652794446187
X2
0.983524229450628
0.9975652794446187
1
线性图:
估计参数:
DependentVariable:
Y
Method:
LeastSquares
Date:
12/14/15Time:
14:
47
Sample:
19852014
Includedobservations:
30
Variable
Coefficient
Std.Error
t-Statistic
Prob.
C
3775.319359326024
8769.9280467183
0.4304846447102545
0.6702600664360232
X1
-0.9127263085551189
1.938518631883585
-0.4708370059194414
0.6415389475333828
X2
5.52278559251161
2.254857054142605
2.449284127508302
.021*********
R-squared
0.9675860494429319
Meandependentvar
173871.8233333334
AdjustedR-squared
0.9651850160683343
S.D.dependentvar
187698.4414104575
S.E.ofregression
35022.22758863741
Akaikeinfocriterion
23.8599929764685
Sumsquaredresid
33117023482.29852
Schwarzcriterion
24.00011271463471
Loglikelihood
-354.8998946470274
Hannan-Quinncriter.
23.90481848460881
F-statistic
402.9873385683694
Durbin-Watsonstat
0.5432849836158895
Prob(F-statistic)
7.850214650723685e-21
统计检验:
(1)拟合优度:
从上表可以得到R2=0.9675860494429319,修正后的可决系数R2=0.9651850160683343,这说明模型对样本的拟合很好。
(2)F检验:
针对H0:
(二)多重共线性的检验及修正
相关系数矩阵:
X1
X2
X1
1
0.9975652794446187
X2
0.9975652794446187
1
辅助回归的R2值
DependentVariable:
X1
Method:
LeastSquares
Date:
12/14/15Time:
15:
13
Sample:
19852014
Includedobservations:
30
Variable
Coefficient
Std.Error
t-Statistic
Prob.
C
-236.150********36
853.796869002943
-0.2765883977316618
0.7841276813528842
X2
1.160353617616671
0.0153301029529616
75.69118232128405
6.205455045312624e-34
R-squared
0.9951364867534203
Meandependentvar
43924.96633333334
AdjustedR-squared
0.9949627898517566
S.D.dependentvar
48106.05415975261
S.E.ofregression
3414.245696799649
Akaikeinfocriterion
19.173********171
Sumsquaredresid
326398062.9872178
Schwarzcriterion
19.26705442341918
Loglikelihood
-285.6046189696256
Hannan-Quinncriter.
19.20352493673524
F-statistic
5729.155********6
Durbin-Watsonstat
0.730903182658975
Prob(F-statistic)
6.205455045312711e-34
因为方差扩大因子VIF大于等于10为204.081,所以存在严重的多重共线性。
对多重共线性的处理:
DependentVariable:
LOG(Y)
Method:
LeastSquares
Date:
12/14/15Time:
15:
35
Sample:
19852014
Includedobservations:
30
Variable
Coefficient
Std.Error
t-Statistic
Prob.
C
3.222118194999216
0.2333483109855165
13.80819163160434
9.378486825750091e-14
LOG(X1)
0.2996147925646949
0.2310979625229066
1.296483920904308
0.2057807637271318
LOG(X2)
0.5392546939375613
0.2485547972749398
2.16956059528822
0.03901090355174436
R-squared
0.9877359836279073
Meandependentvar
11.38310574067848
AdjustedR-squared
0.9868275379707153
S.D.dependentvar
1.306196606830758
S.E.ofregression
0.1499139436548128
Akaikeinfocriterion
-0.8628711662239941
Sumsquaredresid
0.6068031435577368
Schwarzcriterion
-0.7227514280577785
Loglikelihood
15.94306749335991
Hannan-Quinncriter.
-0.8180456580836856
F-statistic
1087.28130935309
Durbin-Watsonstat
0.4125950217515378
Prob(F-statistic)
1.572322907613123e-26
检验模型的异方差:
(一)图形法
(goldfeld-Quandt检验)
DependentVariable:
Y
Method:
LeastSquares
Date:
12/14/15Time:
16:
04
Sample:
111
Includedobservations:
11
Variable
Coefficient
Std.Error
t-Statistic
Prob.
C
5479.879080682394
1364.289295868848
4.016654750041509
0.003859098436432651
X1
1.433135343796905
1.759203025739605
0.814650*********6
0.4388484070935154
X2
3.248229495949973
1.983561826775002
1.637574111431225
0.1401455299675676
R-squared
0.9848299439189845
Meandependentvar
25135.82727272728
AdjustedR-squared
0.9810374298987306
S.D.dependentvar
16782.16114325512
S.E.ofregression
2310.981594158292
Akaikeinfocriterion
18.55573317233263
Sumsquaredresid
42725087.42830722
Schwarzcriterion
18.664250064914
Loglikelihood
.0565********
Hannan-Quinncriter.
18.48732847210918
F-statistic
259.6773376866937
Durbin-Watsonstat
2.590461609402877
Prob(F-statistic)
5.296009374728331e-08
DependentVariable:
Y
Method:
LeastSquares
Date:
12/14/15Time:
16:
05
Sample:
2030
Includedobservations:
11
Variable
Coefficient
Std.Error
t-Statistic
Prob.
C
-131209.0615460853
44951.25277685769
-2.918918905273222
0.01932324601265213
X1
0.9080101521479481
2.513715659620807
0.3612223000134077
0.7272868120760894
X2
4.828090169809233
2.818213945393028
1.71317375591792
0.125033*********2
R-squared
0.9492597452885157
Meandependentvar
376906.7363636364
AdjustedR-squared
0.9365746816106446
S.D.dependentvar
165542.7249904584
S.E.ofregression
41690.91509980208
Akaikeinfocriterion
24.34095492221962
Sumsquaredresid
139********.87124
Schwarzcriterion
24.449471814801
Loglikelihood
-130.8752520722079
Hannan-Quinncriter.
24.27255022199618
F-statistic
74.8328719030782
Durbin-Watsonstat
2.016741299693539
Prob(F-statistic)
6.628428440105899e-06
(三)WHITE检验
HeteroskedasticityTest:
White
F-statistic
8.065639360788028
Prob.F(5,24)
0.0001401031747031907
Obs*R-squared
18.80739651082681
Prob.Chi-Square(5)
0.002087524503307292
ScaledexplainedSS
24.48540340808745
Prob.Chi-Square(5)
0.0001751046944911128
TestEquation:
DependentVariable:
RESID^2
Method:
LeastSquares
Date:
12/14/15Time:
16:
18
Sample:
130
Includedobservations:
30
Variable
Coefficient
Std.Error
t-Statistic
Prob.
C
-172076058.1206036
441097474.8325652
-0.3901089168237053
0.6998968080763495
X1
-434816.1859048981
264665.0535233542
-1.642892327930743
0.1134443283056973
X1^2
-14.02608071414046
17.43640515048546
-0.8044135584765277
0.4290549805564741
X1*X2
.0314********
39.80488928530028
1.030814912898658
0.3129044598250328
X2
.024*******
306551.7690816016
1.737354266916441
.0951********
X2^2
-28.61787842227109
22.88697651710863
-1.250400130435684
0.2232078922692591
R-squared
0.6269132170275604
Meandependentvar
1103900782.743284
AdjustedR-squared
0.5491868039083021
S.D.dependentvar
2013044843.410424
S.E.ofregression
1351611130.658886
Akaikeinfocriterion
45.06385981098074
Sumsquaredresid
4.384446356450382e+19
Schwarzcriterion
45.34409928731318
Loglikelihood
-669.9578971647112
Hannan-Quinncriter.
45.153********136
F-statistic
8.065639360788028
Durbin-Watsonstat
1.62042765626833
Prob(F-statistic)
0.0001401031747031907
所以存在异方差
异方差修正:
自相关的检验与修正:
一图示检验法
DW检验
DW0.54328498对样本容量为30、两个解释变量的模型,5%的显著水平,查DW统计表可知,
=1.567
=1.284模型中DW<
显然模型中有自相关。
BG检验
Breusch-GodfreySerialCorrelationLMTest:
F-statistic
19.24107
Prob.F(2,25)
0.0000
Obs*R-squared
18.18566
Prob.Chi-Square
(2)
0.0001
TestEquation:
DependentVariable:
RESID
Method:
LeastSquares
Date:
12/20/15Time:
20:
42
Sample:
19852014
Includedobservations:
30
Presamplemissingvaluelaggedresidualssettozero.
Variable
Coefficient
Std.Error
t-Statistic
Prob.
C
-3494.489
5807.583
-0.601711
0.5528
X1
3.541529
1.641853
2.157032
0.0408
X2
-3.893207
1.870051
-2.081872
0.0477
RESID(-1)
0.971256
0.203085
4.782511
0.0001
RESID(-2)
0.149014
0.271709
0.548432
0.5883
R-squared
0.606189
Meandependentvar
1.12E-11
AdjustedR-squared
0.543179
S.D.dependentvar
33791.08
S.E.ofregression
22838.90
Akaikeinfocriterion
23.06133
Sumsquaredresid
1.30E+10
Schwarzcriterion
23.29486
Loglikelihood
-340.9200
Hannan-Quinncriter.
23.13604
F-statistic
9.620537
Durbin-Watsonstat
2.015833
Prob(F-statistic)
0.000075
 升级会员
升级会员 